Italian vs Immigrants from Sudan 7th Grade
COMPARE
Italian
Immigrants from Sudan
7th Grade
7th Grade Comparison
Italians
Immigrants from Sudan
97.3%
7TH GRADE
100.0/ 100
METRIC RATING
32nd/ 347
METRIC RANK
95.8%
7TH GRADE
17.0/ 100
METRIC RATING
208th/ 347
METRIC RANK
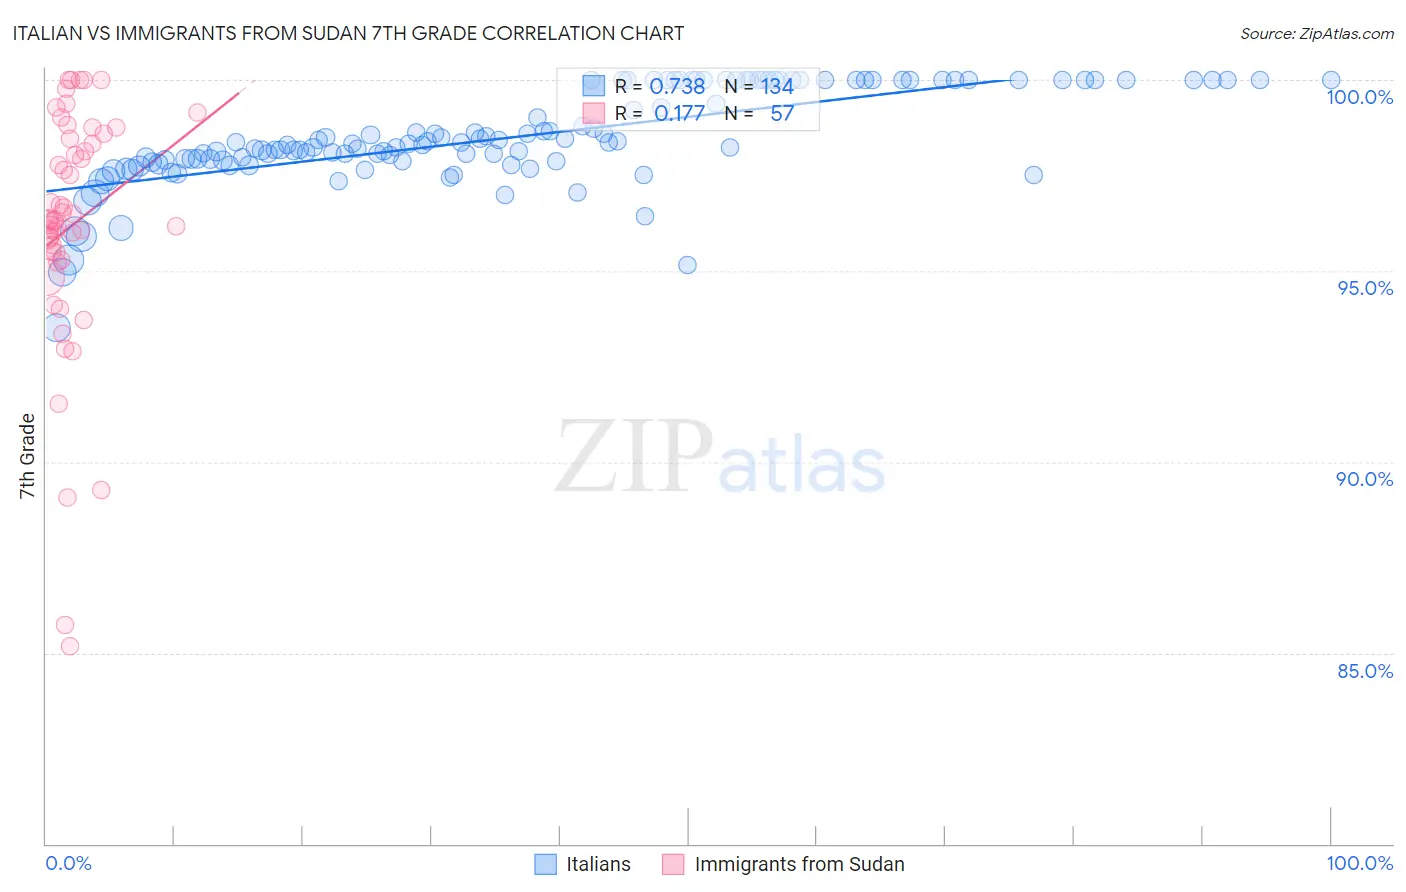
Italian vs Immigrants from Sudan 7th Grade Correlation Chart
The statistical analysis conducted on geographies consisting of 546,284,153 people shows a strong positive correlation between the proportion of Italians and percentage of population with at least 7th grade education in the United States with a correlation coefficient (R) of 0.738 and weighted average of 97.3%. Similarly, the statistical analysis conducted on geographies consisting of 118,959,807 people shows a poor positive correlation between the proportion of Immigrants from Sudan and percentage of population with at least 7th grade education in the United States with a correlation coefficient (R) of 0.177 and weighted average of 95.8%, a difference of 1.6%.
7th Grade Correlation Summary
| Measurement | Italian | Immigrants from Sudan |
| Minimum | 93.5% | 85.2% |
| Maximum | 100.0% | 100.0% |
| Range | 6.5% | 14.8% |
| Mean | 98.5% | 96.2% |
| Median | 98.3% | 96.3% |
| Interquartile 25% (IQ1) | 97.9% | 95.4% |
| Interquartile 75% (IQ3) | 100.0% | 98.5% |
| Interquartile Range (IQR) | 2.1% | 3.1% |
| Standard Deviation (Sample) | 1.2% | 3.2% |
| Standard Deviation (Population) | 1.2% | 3.2% |
Similar Demographics by 7th Grade
Demographics Similar to Italians by 7th Grade
In terms of 7th grade, the demographic groups most similar to Italians are European (97.3%, a difference of 0.0%), Chippewa (97.3%, a difference of 0.010%), Czech (97.4%, a difference of 0.020%), Sioux (97.4%, a difference of 0.030%), and Scandinavian (97.4%, a difference of 0.030%).
| Demographics | Rating | Rank | 7th Grade |
| French | 100.0 /100 | #25 | Exceptional 97.4% |
| Scotch-Irish | 100.0 /100 | #26 | Exceptional 97.4% |
| Danes | 100.0 /100 | #27 | Exceptional 97.4% |
| Sioux | 100.0 /100 | #28 | Exceptional 97.4% |
| Scandinavians | 100.0 /100 | #29 | Exceptional 97.4% |
| Czechs | 100.0 /100 | #30 | Exceptional 97.4% |
| Europeans | 100.0 /100 | #31 | Exceptional 97.3% |
| Italians | 100.0 /100 | #32 | Exceptional 97.3% |
| Chippewa | 100.0 /100 | #33 | Exceptional 97.3% |
| Alaska Natives | 100.0 /100 | #34 | Exceptional 97.3% |
| Swiss | 100.0 /100 | #35 | Exceptional 97.3% |
| Hungarians | 100.0 /100 | #36 | Exceptional 97.2% |
| British | 100.0 /100 | #37 | Exceptional 97.2% |
| Belgians | 100.0 /100 | #38 | Exceptional 97.2% |
| Latvians | 100.0 /100 | #39 | Exceptional 97.2% |
Demographics Similar to Immigrants from Sudan by 7th Grade
In terms of 7th grade, the demographic groups most similar to Immigrants from Sudan are Navajo (95.8%, a difference of 0.0%), African (95.8%, a difference of 0.010%), Dutch West Indian (95.8%, a difference of 0.010%), Hawaiian (95.8%, a difference of 0.010%), and Moroccan (95.8%, a difference of 0.020%).
| Demographics | Rating | Rank | 7th Grade |
| Immigrants | Argentina | 21.9 /100 | #201 | Fair 95.9% |
| Immigrants | Northern Africa | 21.4 /100 | #202 | Fair 95.8% |
| Comanche | 21.1 /100 | #203 | Fair 95.8% |
| Assyrians/Chaldeans/Syriacs | 20.5 /100 | #204 | Fair 95.8% |
| Moroccans | 18.9 /100 | #205 | Poor 95.8% |
| Africans | 17.6 /100 | #206 | Poor 95.8% |
| Navajo | 17.0 /100 | #207 | Poor 95.8% |
| Immigrants | Sudan | 17.0 /100 | #208 | Poor 95.8% |
| Dutch West Indians | 16.1 /100 | #209 | Poor 95.8% |
| Hawaiians | 16.0 /100 | #210 | Poor 95.8% |
| Portuguese | 13.6 /100 | #211 | Poor 95.8% |
| Immigrants | Lebanon | 13.0 /100 | #212 | Poor 95.8% |
| Immigrants | Morocco | 12.6 /100 | #213 | Poor 95.8% |
| Bahamians | 11.6 /100 | #214 | Poor 95.7% |
| Spanish Americans | 9.3 /100 | #215 | Tragic 95.7% |