Italian vs Immigrants from Armenia Seniors Poverty Over the Age of 75
COMPARE
Italian
Immigrants from Armenia
Seniors Poverty Over the Age of 75
Seniors Poverty Over the Age of 75 Comparison
Italians
Immigrants from Armenia
10.8%
SENIORS POVERTY OVER THE AGE OF 75
99.7/ 100
METRIC RATING
34th/ 347
METRIC RANK
17.5%
SENIORS POVERTY OVER THE AGE OF 75
0.0/ 100
METRIC RATING
331st/ 347
METRIC RANK
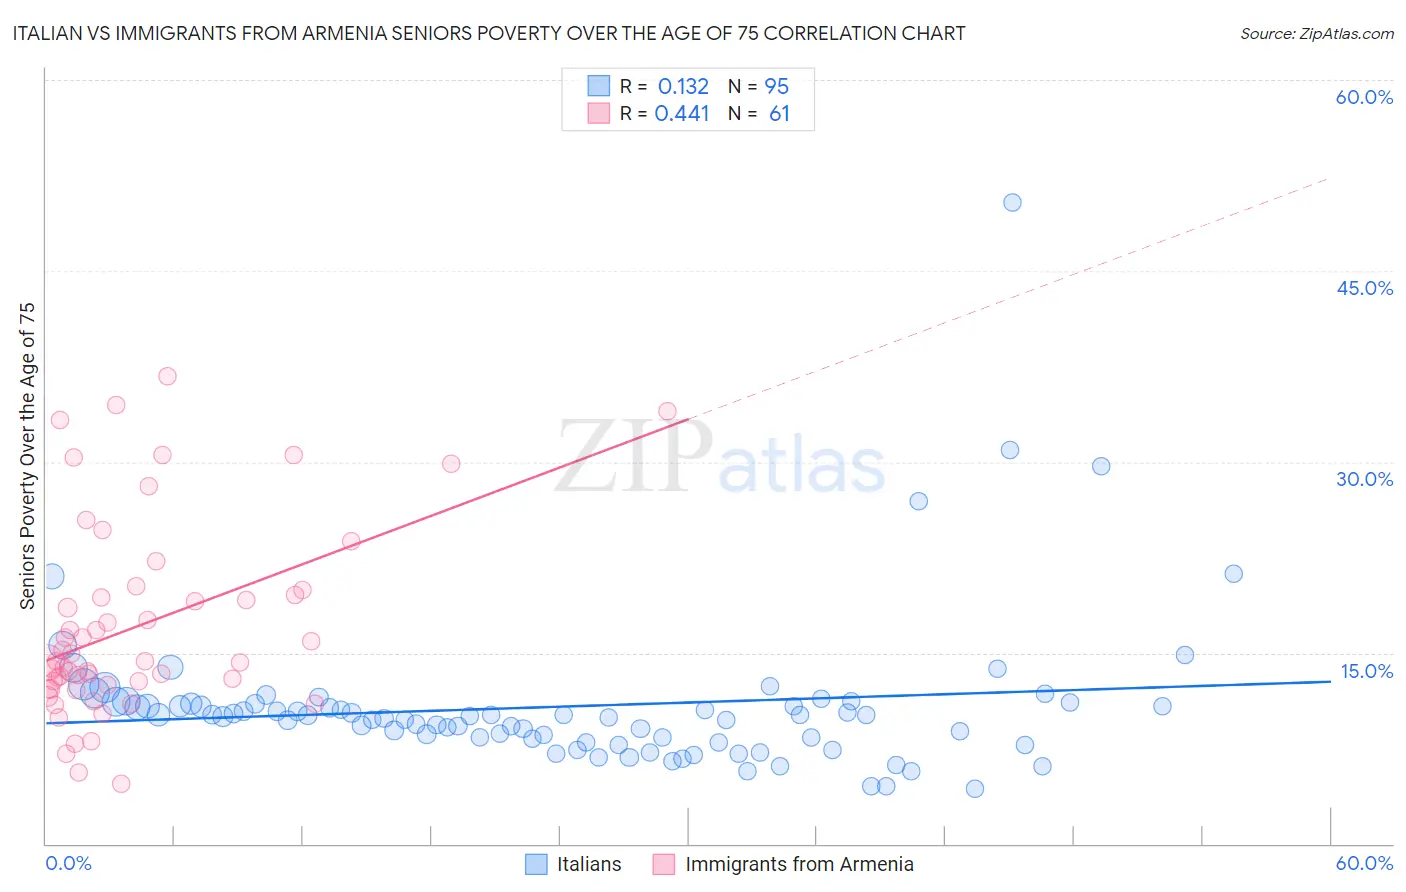
Italian vs Immigrants from Armenia Seniors Poverty Over the Age of 75 Correlation Chart
The statistical analysis conducted on geographies consisting of 557,339,767 people shows a poor positive correlation between the proportion of Italians and poverty level among seniors over the age of 75 in the United States with a correlation coefficient (R) of 0.132 and weighted average of 10.8%. Similarly, the statistical analysis conducted on geographies consisting of 97,487,419 people shows a moderate positive correlation between the proportion of Immigrants from Armenia and poverty level among seniors over the age of 75 in the United States with a correlation coefficient (R) of 0.441 and weighted average of 17.5%, a difference of 62.3%.
Seniors Poverty Over the Age of 75 Correlation Summary
| Measurement | Italian | Immigrants from Armenia |
| Minimum | 4.3% | 4.7% |
| Maximum | 50.4% | 36.7% |
| Range | 46.0% | 32.1% |
| Mean | 10.8% | 17.1% |
| Median | 10.0% | 14.3% |
| Interquartile 25% (IQ1) | 8.3% | 12.3% |
| Interquartile 75% (IQ3) | 11.0% | 19.8% |
| Interquartile Range (IQR) | 2.8% | 7.4% |
| Standard Deviation (Sample) | 6.0% | 7.6% |
| Standard Deviation (Population) | 6.0% | 7.5% |
Similar Demographics by Seniors Poverty Over the Age of 75
Demographics Similar to Italians by Seniors Poverty Over the Age of 75
In terms of seniors poverty over the age of 75, the demographic groups most similar to Italians are Puget Sound Salish (10.8%, a difference of 0.050%), British (10.7%, a difference of 0.11%), Marshallese (10.7%, a difference of 0.25%), Luxembourger (10.8%, a difference of 0.38%), and Swiss (10.7%, a difference of 0.43%).
| Demographics | Rating | Rank | Seniors Poverty Over the Age of 75 |
| Northern Europeans | 99.8 /100 | #27 | Exceptional 10.7% |
| Irish | 99.8 /100 | #28 | Exceptional 10.7% |
| Assyrians/Chaldeans/Syriacs | 99.8 /100 | #29 | Exceptional 10.7% |
| Swiss | 99.7 /100 | #30 | Exceptional 10.7% |
| Marshallese | 99.7 /100 | #31 | Exceptional 10.7% |
| British | 99.7 /100 | #32 | Exceptional 10.7% |
| Puget Sound Salish | 99.7 /100 | #33 | Exceptional 10.8% |
| Italians | 99.7 /100 | #34 | Exceptional 10.8% |
| Luxembourgers | 99.6 /100 | #35 | Exceptional 10.8% |
| Scotch-Irish | 99.6 /100 | #36 | Exceptional 10.8% |
| Latvians | 99.6 /100 | #37 | Exceptional 10.8% |
| Finns | 99.6 /100 | #38 | Exceptional 10.8% |
| Czechoslovakians | 99.4 /100 | #39 | Exceptional 10.9% |
| Thais | 99.4 /100 | #40 | Exceptional 10.9% |
| Immigrants | Lithuania | 99.2 /100 | #41 | Exceptional 11.0% |
Demographics Similar to Immigrants from Armenia by Seniors Poverty Over the Age of 75
In terms of seniors poverty over the age of 75, the demographic groups most similar to Immigrants from Armenia are British West Indian (17.4%, a difference of 0.26%), Immigrants from St. Vincent and the Grenadines (17.5%, a difference of 0.26%), Immigrants from Nicaragua (17.6%, a difference of 0.74%), Immigrants from Grenada (17.8%, a difference of 2.2%), and Immigrants from Dominica (17.0%, a difference of 2.7%).
| Demographics | Rating | Rank | Seniors Poverty Over the Age of 75 |
| Immigrants | Uzbekistan | 0.0 /100 | #324 | Tragic 16.5% |
| Nicaraguans | 0.0 /100 | #325 | Tragic 16.6% |
| Pueblo | 0.0 /100 | #326 | Tragic 16.7% |
| Sioux | 0.0 /100 | #327 | Tragic 16.8% |
| Cape Verdeans | 0.0 /100 | #328 | Tragic 16.8% |
| Immigrants | Dominica | 0.0 /100 | #329 | Tragic 17.0% |
| British West Indians | 0.0 /100 | #330 | Tragic 17.4% |
| Immigrants | Armenia | 0.0 /100 | #331 | Tragic 17.5% |
| Immigrants | St. Vincent and the Grenadines | 0.0 /100 | #332 | Tragic 17.5% |
| Immigrants | Nicaragua | 0.0 /100 | #333 | Tragic 17.6% |
| Immigrants | Grenada | 0.0 /100 | #334 | Tragic 17.8% |
| Cubans | 0.0 /100 | #335 | Tragic 18.0% |
| Immigrants | Caribbean | 0.0 /100 | #336 | Tragic 18.2% |
| Yakama | 0.0 /100 | #337 | Tragic 18.3% |
| Immigrants | Cabo Verde | 0.0 /100 | #338 | Tragic 18.5% |