Israeli vs Greek Disability
COMPARE
Israeli
Greek
Disability
Disability Comparison
Israelis
Greeks
10.8%
DISABILITY
99.9/ 100
METRIC RATING
43rd/ 347
METRIC RANK
11.7%
DISABILITY
46.2/ 100
METRIC RATING
178th/ 347
METRIC RANK
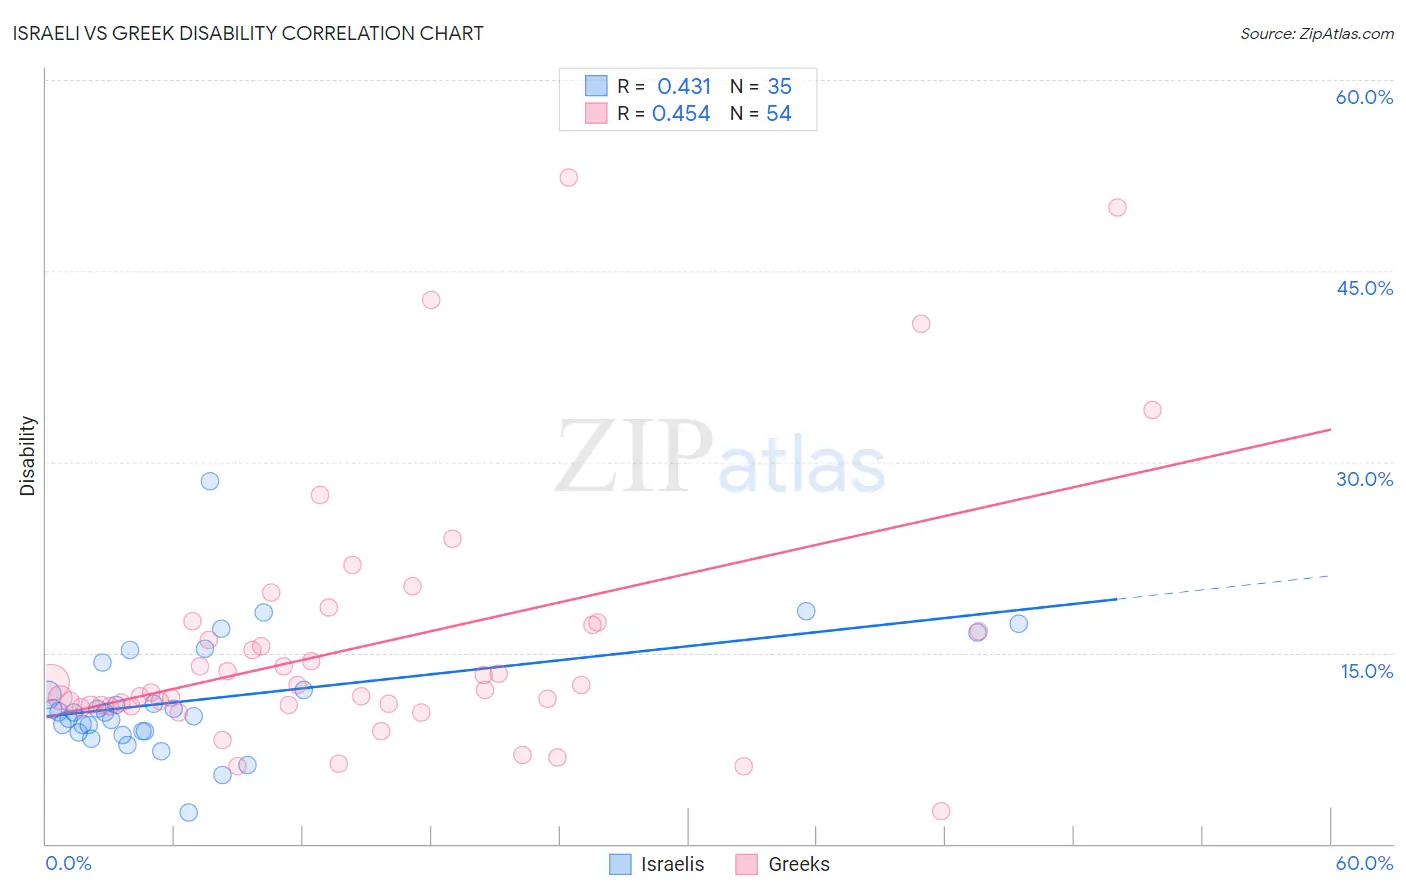
Israeli vs Greek Disability Correlation Chart
The statistical analysis conducted on geographies consisting of 211,184,121 people shows a moderate positive correlation between the proportion of Israelis and percentage of population with a disability in the United States with a correlation coefficient (R) of 0.431 and weighted average of 10.8%. Similarly, the statistical analysis conducted on geographies consisting of 482,714,083 people shows a moderate positive correlation between the proportion of Greeks and percentage of population with a disability in the United States with a correlation coefficient (R) of 0.454 and weighted average of 11.7%, a difference of 8.6%.
Disability Correlation Summary
| Measurement | Israeli | Greek |
| Minimum | 2.4% | 2.5% |
| Maximum | 28.5% | 52.3% |
| Range | 26.1% | 49.8% |
| Mean | 11.4% | 15.7% |
| Median | 10.4% | 12.2% |
| Interquartile 25% (IQ1) | 8.9% | 10.9% |
| Interquartile 75% (IQ3) | 14.2% | 17.2% |
| Interquartile Range (IQR) | 5.4% | 6.3% |
| Standard Deviation (Sample) | 4.7% | 10.4% |
| Standard Deviation (Population) | 4.6% | 10.3% |
Similar Demographics by Disability
Demographics Similar to Israelis by Disability
In terms of disability, the demographic groups most similar to Israelis are Immigrants from Nepal (10.8%, a difference of 0.050%), Immigrants from Japan (10.8%, a difference of 0.10%), Immigrants from Australia (10.8%, a difference of 0.15%), Cambodian (10.8%, a difference of 0.19%), and Mongolian (10.8%, a difference of 0.19%).
| Demographics | Rating | Rank | Disability |
| Ethiopians | 100.0 /100 | #36 | Exceptional 10.7% |
| Turks | 100.0 /100 | #37 | Exceptional 10.7% |
| Afghans | 99.9 /100 | #38 | Exceptional 10.8% |
| Cambodians | 99.9 /100 | #39 | Exceptional 10.8% |
| Mongolians | 99.9 /100 | #40 | Exceptional 10.8% |
| Immigrants | Australia | 99.9 /100 | #41 | Exceptional 10.8% |
| Immigrants | Nepal | 99.9 /100 | #42 | Exceptional 10.8% |
| Israelis | 99.9 /100 | #43 | Exceptional 10.8% |
| Immigrants | Japan | 99.9 /100 | #44 | Exceptional 10.8% |
| Immigrants | Peru | 99.9 /100 | #45 | Exceptional 10.8% |
| Tongans | 99.9 /100 | #46 | Exceptional 10.8% |
| Taiwanese | 99.9 /100 | #47 | Exceptional 10.8% |
| Soviet Union | 99.9 /100 | #48 | Exceptional 10.9% |
| Vietnamese | 99.9 /100 | #49 | Exceptional 10.9% |
| Immigrants | Saudi Arabia | 99.9 /100 | #50 | Exceptional 10.9% |
Demographics Similar to Greeks by Disability
In terms of disability, the demographic groups most similar to Greeks are Immigrants from Central America (11.7%, a difference of 0.020%), Immigrants from Western Africa (11.7%, a difference of 0.060%), Haitian (11.7%, a difference of 0.11%), Albanian (11.7%, a difference of 0.17%), and Immigrants from Armenia (11.7%, a difference of 0.19%).
| Demographics | Rating | Rank | Disability |
| Immigrants | Southern Europe | 52.8 /100 | #171 | Average 11.7% |
| Trinidadians and Tobagonians | 52.7 /100 | #172 | Average 11.7% |
| Maltese | 50.6 /100 | #173 | Average 11.7% |
| Albanians | 50.0 /100 | #174 | Average 11.7% |
| Haitians | 48.6 /100 | #175 | Average 11.7% |
| Immigrants | Western Africa | 47.5 /100 | #176 | Average 11.7% |
| Immigrants | Central America | 46.6 /100 | #177 | Average 11.7% |
| Greeks | 46.2 /100 | #178 | Average 11.7% |
| Immigrants | Armenia | 41.9 /100 | #179 | Average 11.7% |
| Immigrants | Honduras | 37.8 /100 | #180 | Fair 11.8% |
| Immigrants | Oceania | 34.3 /100 | #181 | Fair 11.8% |
| Icelanders | 34.0 /100 | #182 | Fair 11.8% |
| Hondurans | 31.2 /100 | #183 | Fair 11.8% |
| Iraqis | 30.0 /100 | #184 | Fair 11.8% |
| Immigrants | Burma/Myanmar | 28.5 /100 | #185 | Fair 11.8% |