Israeli vs Immigrants from Serbia Disability
COMPARE
Israeli
Immigrants from Serbia
Disability
Disability Comparison
Israelis
Immigrants from Serbia
10.8%
DISABILITY
99.9/ 100
METRIC RATING
43rd/ 347
METRIC RANK
11.0%
DISABILITY
99.4/ 100
METRIC RATING
74th/ 347
METRIC RANK
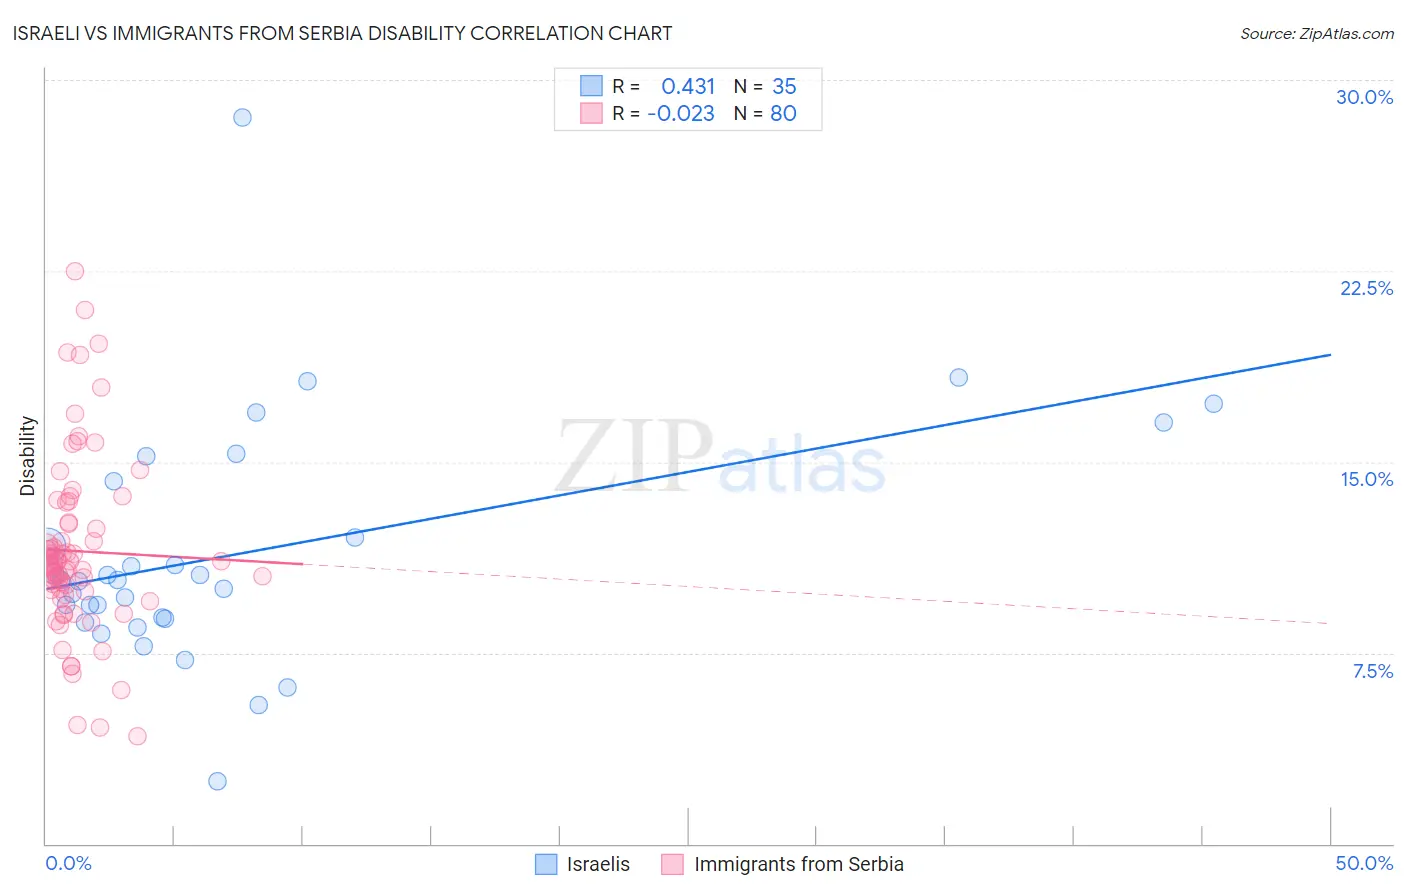
Israeli vs Immigrants from Serbia Disability Correlation Chart
The statistical analysis conducted on geographies consisting of 211,184,121 people shows a moderate positive correlation between the proportion of Israelis and percentage of population with a disability in the United States with a correlation coefficient (R) of 0.431 and weighted average of 10.8%. Similarly, the statistical analysis conducted on geographies consisting of 131,748,462 people shows no correlation between the proportion of Immigrants from Serbia and percentage of population with a disability in the United States with a correlation coefficient (R) of -0.023 and weighted average of 11.0%, a difference of 2.4%.
Disability Correlation Summary
| Measurement | Israeli | Immigrants from Serbia |
| Minimum | 2.4% | 4.2% |
| Maximum | 28.5% | 22.5% |
| Range | 26.1% | 18.3% |
| Mean | 11.4% | 11.5% |
| Median | 10.4% | 11.0% |
| Interquartile 25% (IQ1) | 8.9% | 10.0% |
| Interquartile 75% (IQ3) | 14.2% | 12.6% |
| Interquartile Range (IQR) | 5.4% | 2.6% |
| Standard Deviation (Sample) | 4.7% | 3.5% |
| Standard Deviation (Population) | 4.6% | 3.4% |
Similar Demographics by Disability
Demographics Similar to Israelis by Disability
In terms of disability, the demographic groups most similar to Israelis are Immigrants from Nepal (10.8%, a difference of 0.050%), Immigrants from Japan (10.8%, a difference of 0.10%), Immigrants from Australia (10.8%, a difference of 0.15%), Cambodian (10.8%, a difference of 0.19%), and Mongolian (10.8%, a difference of 0.19%).
| Demographics | Rating | Rank | Disability |
| Ethiopians | 100.0 /100 | #36 | Exceptional 10.7% |
| Turks | 100.0 /100 | #37 | Exceptional 10.7% |
| Afghans | 99.9 /100 | #38 | Exceptional 10.8% |
| Cambodians | 99.9 /100 | #39 | Exceptional 10.8% |
| Mongolians | 99.9 /100 | #40 | Exceptional 10.8% |
| Immigrants | Australia | 99.9 /100 | #41 | Exceptional 10.8% |
| Immigrants | Nepal | 99.9 /100 | #42 | Exceptional 10.8% |
| Israelis | 99.9 /100 | #43 | Exceptional 10.8% |
| Immigrants | Japan | 99.9 /100 | #44 | Exceptional 10.8% |
| Immigrants | Peru | 99.9 /100 | #45 | Exceptional 10.8% |
| Tongans | 99.9 /100 | #46 | Exceptional 10.8% |
| Taiwanese | 99.9 /100 | #47 | Exceptional 10.8% |
| Soviet Union | 99.9 /100 | #48 | Exceptional 10.9% |
| Vietnamese | 99.9 /100 | #49 | Exceptional 10.9% |
| Immigrants | Saudi Arabia | 99.9 /100 | #50 | Exceptional 10.9% |
Demographics Similar to Immigrants from Serbia by Disability
In terms of disability, the demographic groups most similar to Immigrants from Serbia are Immigrants from Bangladesh (11.0%, a difference of 0.020%), Immigrants from Vietnam (11.0%, a difference of 0.020%), Immigrants from Chile (11.0%, a difference of 0.040%), Sierra Leonean (11.0%, a difference of 0.050%), and Immigrants from Belgium (11.0%, a difference of 0.050%).
| Demographics | Rating | Rank | Disability |
| Colombians | 99.6 /100 | #67 | Exceptional 11.0% |
| Immigrants | Afghanistan | 99.6 /100 | #68 | Exceptional 11.0% |
| Sri Lankans | 99.5 /100 | #69 | Exceptional 11.0% |
| Immigrants | France | 99.4 /100 | #70 | Exceptional 11.0% |
| Immigrants | Lebanon | 99.4 /100 | #71 | Exceptional 11.0% |
| Immigrants | Chile | 99.4 /100 | #72 | Exceptional 11.0% |
| Immigrants | Bangladesh | 99.4 /100 | #73 | Exceptional 11.0% |
| Immigrants | Serbia | 99.4 /100 | #74 | Exceptional 11.0% |
| Immigrants | Vietnam | 99.4 /100 | #75 | Exceptional 11.0% |
| Sierra Leoneans | 99.3 /100 | #76 | Exceptional 11.0% |
| Immigrants | Belgium | 99.3 /100 | #77 | Exceptional 11.0% |
| Immigrants | Cameroon | 99.3 /100 | #78 | Exceptional 11.1% |
| Immigrants | Jordan | 99.3 /100 | #79 | Exceptional 11.1% |
| Immigrants | Ireland | 99.3 /100 | #80 | Exceptional 11.1% |
| Immigrants | Poland | 99.1 /100 | #81 | Exceptional 11.1% |