Israeli vs Greek Householder Income Over 65 years
COMPARE
Israeli
Greek
Householder Income Over 65 years
Householder Income Over 65 years Comparison
Israelis
Greeks
$66,636
HOUSEHOLDER INCOME OVER 65 YEARS
99.7/ 100
METRIC RATING
51st/ 347
METRIC RANK
$65,306
HOUSEHOLDER INCOME OVER 65 YEARS
98.9/ 100
METRIC RATING
71st/ 347
METRIC RANK
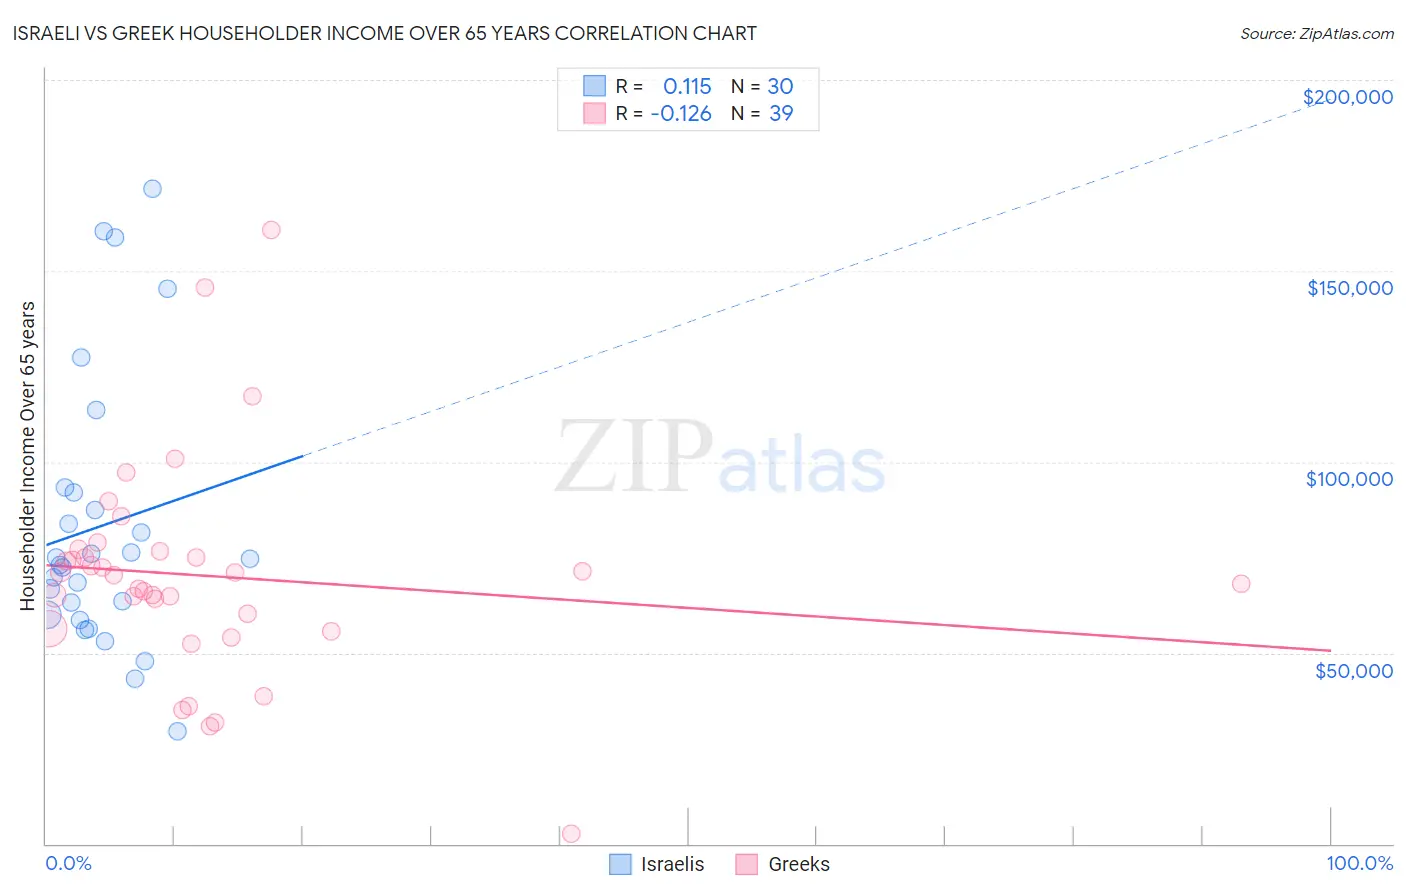
Israeli vs Greek Householder Income Over 65 years Correlation Chart
The statistical analysis conducted on geographies consisting of 210,595,359 people shows a poor positive correlation between the proportion of Israelis and household income with householder over the age of 65 in the United States with a correlation coefficient (R) of 0.115 and weighted average of $66,636. Similarly, the statistical analysis conducted on geographies consisting of 480,541,724 people shows a poor negative correlation between the proportion of Greeks and household income with householder over the age of 65 in the United States with a correlation coefficient (R) of -0.126 and weighted average of $65,306, a difference of 2.0%.
Householder Income Over 65 years Correlation Summary
| Measurement | Israeli | Greek |
| Minimum | $29,457 | $2,499 |
| Maximum | $171,563 | $160,774 |
| Range | $142,106 | $158,275 |
| Mean | $83,272 | $70,156 |
| Median | $73,731 | $70,510 |
| Interquartile 25% (IQ1) | $59,859 | $56,429 |
| Interquartile 75% (IQ3) | $92,033 | $76,518 |
| Interquartile Range (IQR) | $32,174 | $20,089 |
| Standard Deviation (Sample) | $36,038 | $28,523 |
| Standard Deviation (Population) | $35,432 | $28,155 |
Demographics Similar to Israelis and Greeks by Householder Income Over 65 years
In terms of householder income over 65 years, the demographic groups most similar to Israelis are Immigrants from Scotland ($66,620, a difference of 0.020%), Immigrants from Pakistan ($66,617, a difference of 0.030%), Immigrants from Netherlands ($66,463, a difference of 0.26%), Immigrants from Czechoslovakia ($66,376, a difference of 0.39%), and Laotian ($66,306, a difference of 0.50%). Similarly, the demographic groups most similar to Greeks are Mongolian ($65,326, a difference of 0.030%), Samoan ($65,427, a difference of 0.19%), Egyptian ($65,441, a difference of 0.21%), Immigrants from Malaysia ($65,497, a difference of 0.29%), and South African ($65,652, a difference of 0.53%).
| Demographics | Rating | Rank | Householder Income Over 65 years |
| Israelis | 99.7 /100 | #51 | Exceptional $66,636 |
| Immigrants | Scotland | 99.7 /100 | #52 | Exceptional $66,620 |
| Immigrants | Pakistan | 99.7 /100 | #53 | Exceptional $66,617 |
| Immigrants | Netherlands | 99.7 /100 | #54 | Exceptional $66,463 |
| Immigrants | Czechoslovakia | 99.7 /100 | #55 | Exceptional $66,376 |
| Laotians | 99.6 /100 | #56 | Exceptional $66,306 |
| Bulgarians | 99.6 /100 | #57 | Exceptional $66,236 |
| Immigrants | Philippines | 99.6 /100 | #58 | Exceptional $66,161 |
| Immigrants | Norway | 99.5 /100 | #59 | Exceptional $66,118 |
| Immigrants | Lithuania | 99.5 /100 | #60 | Exceptional $66,087 |
| Maltese | 99.5 /100 | #61 | Exceptional $66,027 |
| Immigrants | Sierra Leone | 99.5 /100 | #62 | Exceptional $66,009 |
| Marshallese | 99.4 /100 | #63 | Exceptional $65,874 |
| Zimbabweans | 99.4 /100 | #64 | Exceptional $65,854 |
| Immigrants | England | 99.3 /100 | #65 | Exceptional $65,715 |
| South Africans | 99.3 /100 | #66 | Exceptional $65,652 |
| Immigrants | Malaysia | 99.1 /100 | #67 | Exceptional $65,497 |
| Egyptians | 99.1 /100 | #68 | Exceptional $65,441 |
| Samoans | 99.1 /100 | #69 | Exceptional $65,427 |
| Mongolians | 99.0 /100 | #70 | Exceptional $65,326 |
| Greeks | 98.9 /100 | #71 | Exceptional $65,306 |