Israeli vs New Zealander Disability
COMPARE
Israeli
New Zealander
Disability
Disability Comparison
Israelis
New Zealanders
10.8%
DISABILITY
99.9/ 100
METRIC RATING
43rd/ 347
METRIC RANK
11.5%
DISABILITY
87.0/ 100
METRIC RATING
138th/ 347
METRIC RANK
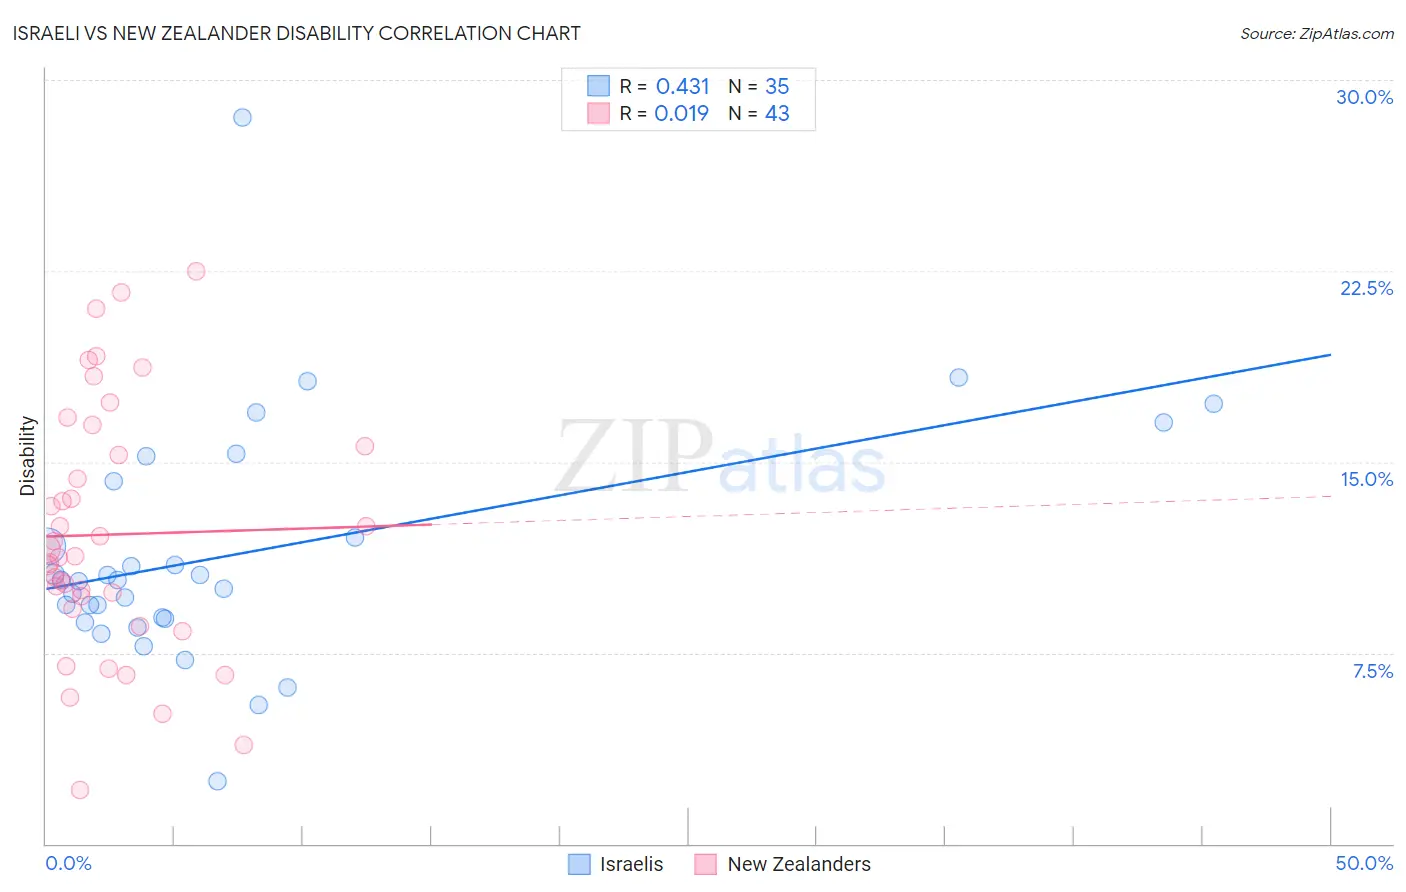
Israeli vs New Zealander Disability Correlation Chart
The statistical analysis conducted on geographies consisting of 211,184,121 people shows a moderate positive correlation between the proportion of Israelis and percentage of population with a disability in the United States with a correlation coefficient (R) of 0.431 and weighted average of 10.8%. Similarly, the statistical analysis conducted on geographies consisting of 106,922,705 people shows no correlation between the proportion of New Zealanders and percentage of population with a disability in the United States with a correlation coefficient (R) of 0.019 and weighted average of 11.5%, a difference of 6.2%.
Disability Correlation Summary
| Measurement | Israeli | New Zealander |
| Minimum | 2.4% | 2.1% |
| Maximum | 28.5% | 22.5% |
| Range | 26.1% | 20.4% |
| Mean | 11.4% | 12.1% |
| Median | 10.4% | 11.3% |
| Interquartile 25% (IQ1) | 8.9% | 9.2% |
| Interquartile 75% (IQ3) | 14.2% | 15.6% |
| Interquartile Range (IQR) | 5.4% | 6.4% |
| Standard Deviation (Sample) | 4.7% | 4.9% |
| Standard Deviation (Population) | 4.6% | 4.8% |
Similar Demographics by Disability
Demographics Similar to Israelis by Disability
In terms of disability, the demographic groups most similar to Israelis are Immigrants from Nepal (10.8%, a difference of 0.050%), Immigrants from Japan (10.8%, a difference of 0.10%), Immigrants from Australia (10.8%, a difference of 0.15%), Cambodian (10.8%, a difference of 0.19%), and Mongolian (10.8%, a difference of 0.19%).
| Demographics | Rating | Rank | Disability |
| Ethiopians | 100.0 /100 | #36 | Exceptional 10.7% |
| Turks | 100.0 /100 | #37 | Exceptional 10.7% |
| Afghans | 99.9 /100 | #38 | Exceptional 10.8% |
| Cambodians | 99.9 /100 | #39 | Exceptional 10.8% |
| Mongolians | 99.9 /100 | #40 | Exceptional 10.8% |
| Immigrants | Australia | 99.9 /100 | #41 | Exceptional 10.8% |
| Immigrants | Nepal | 99.9 /100 | #42 | Exceptional 10.8% |
| Israelis | 99.9 /100 | #43 | Exceptional 10.8% |
| Immigrants | Japan | 99.9 /100 | #44 | Exceptional 10.8% |
| Immigrants | Peru | 99.9 /100 | #45 | Exceptional 10.8% |
| Tongans | 99.9 /100 | #46 | Exceptional 10.8% |
| Taiwanese | 99.9 /100 | #47 | Exceptional 10.8% |
| Soviet Union | 99.9 /100 | #48 | Exceptional 10.9% |
| Vietnamese | 99.9 /100 | #49 | Exceptional 10.9% |
| Immigrants | Saudi Arabia | 99.9 /100 | #50 | Exceptional 10.9% |
Demographics Similar to New Zealanders by Disability
In terms of disability, the demographic groups most similar to New Zealanders are Ghanaian (11.5%, a difference of 0.0%), Kenyan (11.5%, a difference of 0.010%), Russian (11.5%, a difference of 0.020%), Immigrants from St. Vincent and the Grenadines (11.4%, a difference of 0.080%), and Ugandan (11.4%, a difference of 0.090%).
| Demographics | Rating | Rank | Disability |
| Immigrants | Croatia | 89.8 /100 | #131 | Excellent 11.4% |
| Immigrants | Africa | 89.3 /100 | #132 | Excellent 11.4% |
| Arabs | 89.1 /100 | #133 | Excellent 11.4% |
| Immigrants | Guyana | 88.3 /100 | #134 | Excellent 11.4% |
| Ugandans | 87.9 /100 | #135 | Excellent 11.4% |
| Immigrants | St. Vincent and the Grenadines | 87.8 /100 | #136 | Excellent 11.4% |
| Kenyans | 87.1 /100 | #137 | Excellent 11.5% |
| New Zealanders | 87.0 /100 | #138 | Excellent 11.5% |
| Ghanaians | 87.0 /100 | #139 | Excellent 11.5% |
| Russians | 86.8 /100 | #140 | Excellent 11.5% |
| Immigrants | Grenada | 86.1 /100 | #141 | Excellent 11.5% |
| Immigrants | Sudan | 85.3 /100 | #142 | Excellent 11.5% |
| Moroccans | 83.3 /100 | #143 | Excellent 11.5% |
| Australians | 82.5 /100 | #144 | Excellent 11.5% |
| Nigerians | 81.3 /100 | #145 | Excellent 11.5% |