Israeli vs Greek Nursery School
COMPARE
Israeli
Greek
Nursery School
Nursery School Comparison
Israelis
Greeks
98.1%
NURSERY SCHOOL
88.2/ 100
METRIC RATING
137th/ 347
METRIC RANK
98.4%
NURSERY SCHOOL
99.7/ 100
METRIC RATING
64th/ 347
METRIC RANK
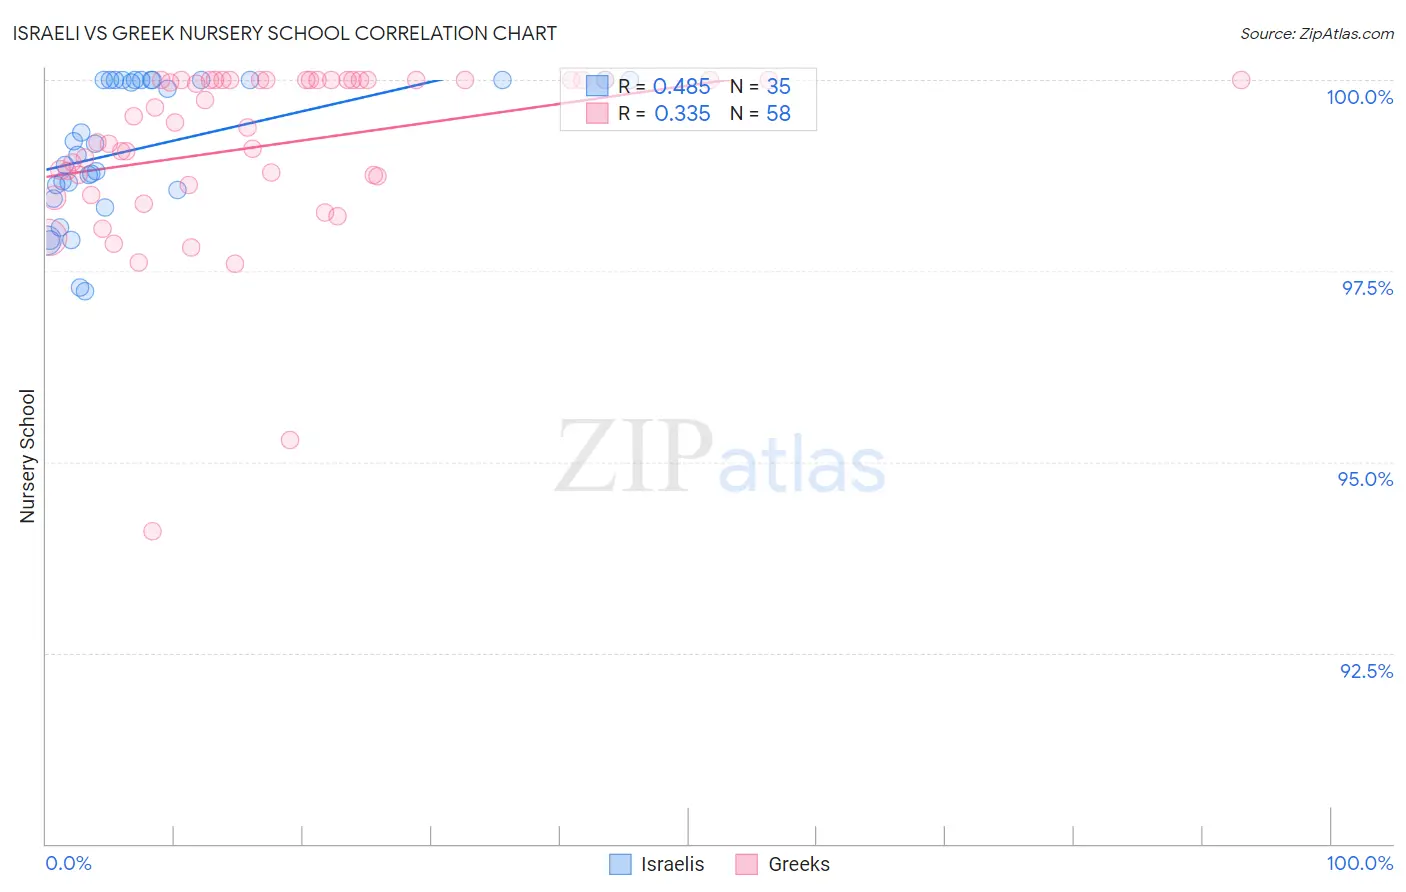
Israeli vs Greek Nursery School Correlation Chart
The statistical analysis conducted on geographies consisting of 211,219,690 people shows a moderate positive correlation between the proportion of Israelis and percentage of population with at least nursery school education in the United States with a correlation coefficient (R) of 0.485 and weighted average of 98.1%. Similarly, the statistical analysis conducted on geographies consisting of 482,775,358 people shows a mild positive correlation between the proportion of Greeks and percentage of population with at least nursery school education in the United States with a correlation coefficient (R) of 0.335 and weighted average of 98.4%, a difference of 0.29%.
Nursery School Correlation Summary
| Measurement | Israeli | Greek |
| Minimum | 97.2% | 94.1% |
| Maximum | 100.0% | 100.0% |
| Range | 2.8% | 5.9% |
| Mean | 99.1% | 99.1% |
| Median | 99.2% | 99.5% |
| Interquartile 25% (IQ1) | 98.6% | 98.7% |
| Interquartile 75% (IQ3) | 100.0% | 100.0% |
| Interquartile Range (IQR) | 1.4% | 1.3% |
| Standard Deviation (Sample) | 0.88% | 1.1% |
| Standard Deviation (Population) | 0.87% | 1.1% |
Similar Demographics by Nursery School
Demographics Similar to Israelis by Nursery School
In terms of nursery school, the demographic groups most similar to Israelis are Immigrants from Romania (98.1%, a difference of 0.0%), Blackfeet (98.1%, a difference of 0.0%), Immigrants from Bulgaria (98.1%, a difference of 0.010%), Immigrants from Hungary (98.1%, a difference of 0.010%), and Immigrants from Kuwait (98.1%, a difference of 0.010%).
| Demographics | Rating | Rank | Nursery School |
| Immigrants | Croatia | 91.4 /100 | #130 | Exceptional 98.2% |
| Spaniards | 91.1 /100 | #131 | Exceptional 98.2% |
| Seminole | 90.9 /100 | #132 | Exceptional 98.2% |
| Immigrants | Europe | 90.7 /100 | #133 | Exceptional 98.1% |
| Immigrants | Bulgaria | 89.4 /100 | #134 | Excellent 98.1% |
| Immigrants | Hungary | 89.3 /100 | #135 | Excellent 98.1% |
| Immigrants | Kuwait | 88.9 /100 | #136 | Excellent 98.1% |
| Israelis | 88.2 /100 | #137 | Excellent 98.1% |
| Immigrants | Romania | 88.0 /100 | #138 | Excellent 98.1% |
| Blackfeet | 87.5 /100 | #139 | Excellent 98.1% |
| Palestinians | 83.7 /100 | #140 | Excellent 98.1% |
| Immigrants | Turkey | 83.0 /100 | #141 | Excellent 98.1% |
| Burmese | 81.7 /100 | #142 | Excellent 98.1% |
| Marshallese | 81.2 /100 | #143 | Excellent 98.1% |
| Alsatians | 80.3 /100 | #144 | Excellent 98.1% |
Demographics Similar to Greeks by Nursery School
In terms of nursery school, the demographic groups most similar to Greeks are New Zealander (98.4%, a difference of 0.0%), Creek (98.4%, a difference of 0.0%), Immigrants from North America (98.4%, a difference of 0.0%), Maltese (98.4%, a difference of 0.0%), and Austrian (98.4%, a difference of 0.010%).
| Demographics | Rating | Rank | Nursery School |
| Austrians | 99.8 /100 | #57 | Exceptional 98.4% |
| Bulgarians | 99.8 /100 | #58 | Exceptional 98.4% |
| Immigrants | Canada | 99.8 /100 | #59 | Exceptional 98.4% |
| Slavs | 99.8 /100 | #60 | Exceptional 98.4% |
| New Zealanders | 99.7 /100 | #61 | Exceptional 98.4% |
| Creek | 99.7 /100 | #62 | Exceptional 98.4% |
| Immigrants | North America | 99.7 /100 | #63 | Exceptional 98.4% |
| Greeks | 99.7 /100 | #64 | Exceptional 98.4% |
| Maltese | 99.7 /100 | #65 | Exceptional 98.4% |
| Canadians | 99.7 /100 | #66 | Exceptional 98.4% |
| Immigrants | Northern Europe | 99.6 /100 | #67 | Exceptional 98.4% |
| Russians | 99.6 /100 | #68 | Exceptional 98.4% |
| Immigrants | Austria | 99.6 /100 | #69 | Exceptional 98.4% |
| Cheyenne | 99.6 /100 | #70 | Exceptional 98.4% |
| Serbians | 99.6 /100 | #71 | Exceptional 98.4% |