Immigrants from Bahamas vs Greek Disability
COMPARE
Immigrants from Bahamas
Greek
Disability
Disability Comparison
Immigrants from Bahamas
Greeks
12.1%
DISABILITY
4.7/ 100
METRIC RATING
220th/ 347
METRIC RANK
11.7%
DISABILITY
46.2/ 100
METRIC RATING
178th/ 347
METRIC RANK
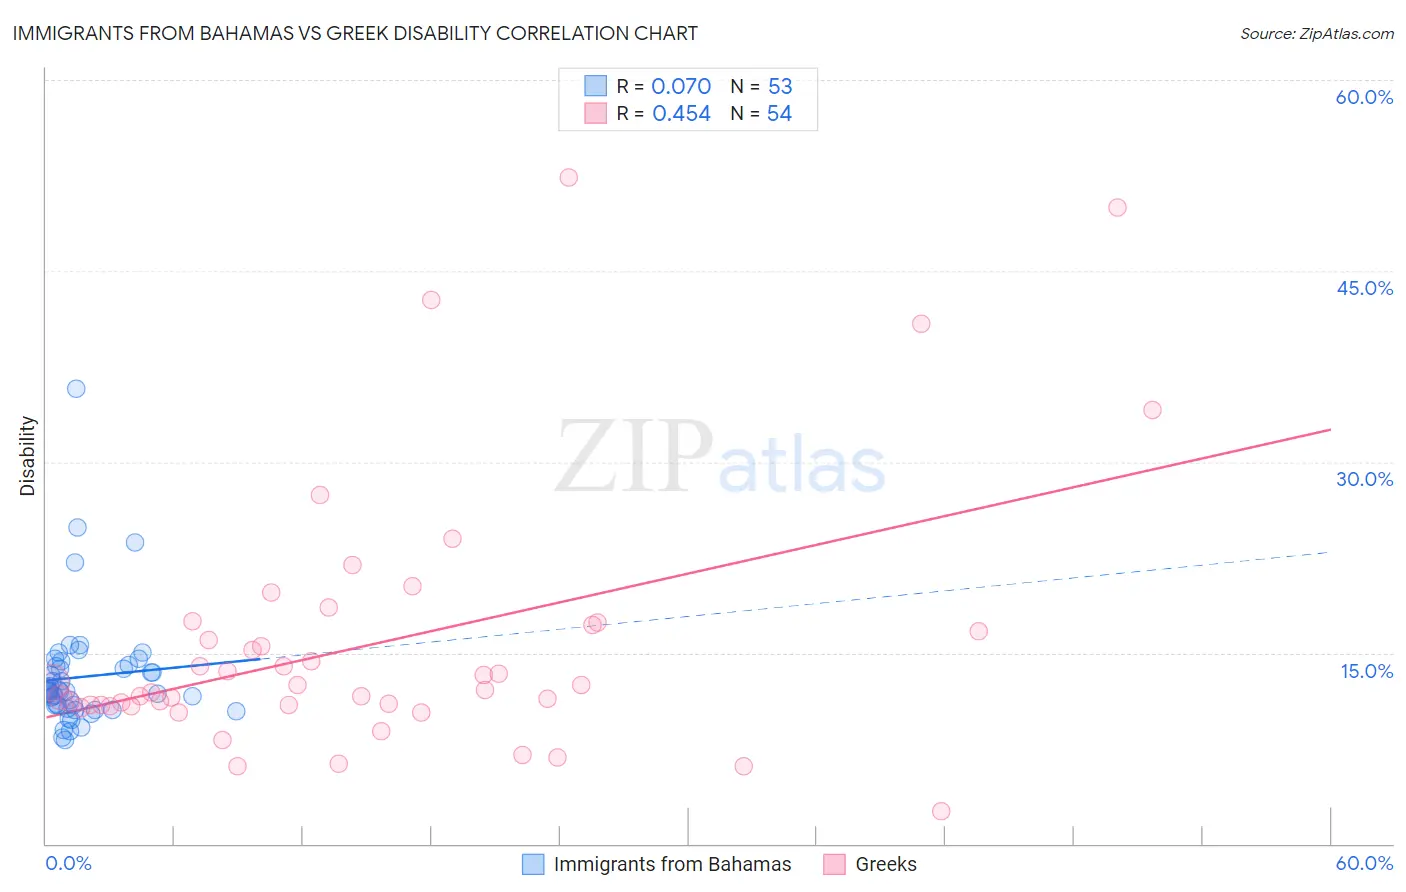
Immigrants from Bahamas vs Greek Disability Correlation Chart
The statistical analysis conducted on geographies consisting of 104,655,290 people shows a slight positive correlation between the proportion of Immigrants from Bahamas and percentage of population with a disability in the United States with a correlation coefficient (R) of 0.070 and weighted average of 12.1%. Similarly, the statistical analysis conducted on geographies consisting of 482,714,083 people shows a moderate positive correlation between the proportion of Greeks and percentage of population with a disability in the United States with a correlation coefficient (R) of 0.454 and weighted average of 11.7%, a difference of 3.2%.
Disability Correlation Summary
| Measurement | Immigrants from Bahamas | Greek |
| Minimum | 8.2% | 2.5% |
| Maximum | 35.8% | 52.3% |
| Range | 27.6% | 49.8% |
| Mean | 13.1% | 15.7% |
| Median | 12.0% | 12.2% |
| Interquartile 25% (IQ1) | 10.8% | 10.9% |
| Interquartile 75% (IQ3) | 14.0% | 17.2% |
| Interquartile Range (IQR) | 3.2% | 6.3% |
| Standard Deviation (Sample) | 4.6% | 10.4% |
| Standard Deviation (Population) | 4.5% | 10.3% |
Similar Demographics by Disability
Demographics Similar to Immigrants from Bahamas by Disability
In terms of disability, the demographic groups most similar to Immigrants from Bahamas are Croatian (12.1%, a difference of 0.040%), Immigrants from Jamaica (12.1%, a difference of 0.080%), Northern European (12.1%, a difference of 0.12%), Immigrants from North America (12.1%, a difference of 0.15%), and Panamanian (12.1%, a difference of 0.16%).
| Demographics | Rating | Rank | Disability |
| Immigrants | Iraq | 7.1 /100 | #213 | Tragic 12.0% |
| Immigrants | Somalia | 6.8 /100 | #214 | Tragic 12.0% |
| Immigrants | Canada | 6.1 /100 | #215 | Tragic 12.1% |
| Panamanians | 5.4 /100 | #216 | Tragic 12.1% |
| Immigrants | North America | 5.3 /100 | #217 | Tragic 12.1% |
| Immigrants | Jamaica | 5.0 /100 | #218 | Tragic 12.1% |
| Croatians | 4.9 /100 | #219 | Tragic 12.1% |
| Immigrants | Bahamas | 4.7 /100 | #220 | Tragic 12.1% |
| Northern Europeans | 4.2 /100 | #221 | Tragic 12.1% |
| Spanish American Indians | 4.1 /100 | #222 | Tragic 12.1% |
| Hispanics or Latinos | 3.9 /100 | #223 | Tragic 12.1% |
| Mexicans | 3.7 /100 | #224 | Tragic 12.1% |
| Senegalese | 3.5 /100 | #225 | Tragic 12.1% |
| Jamaicans | 3.3 /100 | #226 | Tragic 12.1% |
| Alsatians | 3.3 /100 | #227 | Tragic 12.1% |
Demographics Similar to Greeks by Disability
In terms of disability, the demographic groups most similar to Greeks are Immigrants from Central America (11.7%, a difference of 0.020%), Immigrants from Western Africa (11.7%, a difference of 0.060%), Haitian (11.7%, a difference of 0.11%), Albanian (11.7%, a difference of 0.17%), and Immigrants from Armenia (11.7%, a difference of 0.19%).
| Demographics | Rating | Rank | Disability |
| Immigrants | Southern Europe | 52.8 /100 | #171 | Average 11.7% |
| Trinidadians and Tobagonians | 52.7 /100 | #172 | Average 11.7% |
| Maltese | 50.6 /100 | #173 | Average 11.7% |
| Albanians | 50.0 /100 | #174 | Average 11.7% |
| Haitians | 48.6 /100 | #175 | Average 11.7% |
| Immigrants | Western Africa | 47.5 /100 | #176 | Average 11.7% |
| Immigrants | Central America | 46.6 /100 | #177 | Average 11.7% |
| Greeks | 46.2 /100 | #178 | Average 11.7% |
| Immigrants | Armenia | 41.9 /100 | #179 | Average 11.7% |
| Immigrants | Honduras | 37.8 /100 | #180 | Fair 11.8% |
| Immigrants | Oceania | 34.3 /100 | #181 | Fair 11.8% |
| Icelanders | 34.0 /100 | #182 | Fair 11.8% |
| Hondurans | 31.2 /100 | #183 | Fair 11.8% |
| Iraqis | 30.0 /100 | #184 | Fair 11.8% |
| Immigrants | Burma/Myanmar | 28.5 /100 | #185 | Fair 11.8% |