Israeli vs Syrian Disability
COMPARE
Israeli
Syrian
Disability
Disability Comparison
Israelis
Syrians
10.8%
DISABILITY
99.9/ 100
METRIC RATING
43rd/ 347
METRIC RANK
11.7%
DISABILITY
58.5/ 100
METRIC RATING
164th/ 347
METRIC RANK
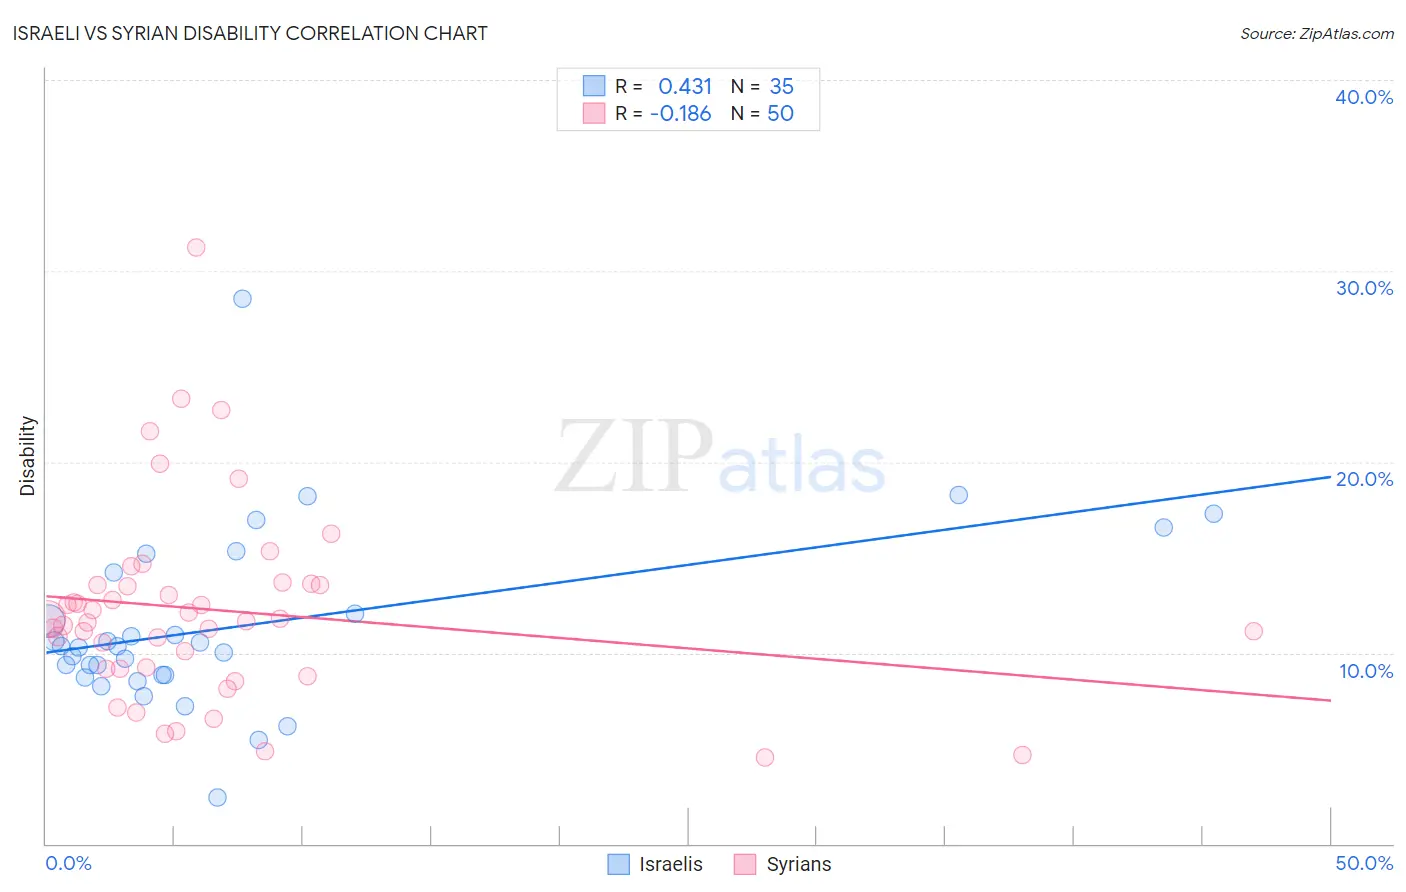
Israeli vs Syrian Disability Correlation Chart
The statistical analysis conducted on geographies consisting of 211,184,121 people shows a moderate positive correlation between the proportion of Israelis and percentage of population with a disability in the United States with a correlation coefficient (R) of 0.431 and weighted average of 10.8%. Similarly, the statistical analysis conducted on geographies consisting of 266,315,243 people shows a poor negative correlation between the proportion of Syrians and percentage of population with a disability in the United States with a correlation coefficient (R) of -0.186 and weighted average of 11.7%, a difference of 8.1%.
Disability Correlation Summary
| Measurement | Israeli | Syrian |
| Minimum | 2.4% | 4.5% |
| Maximum | 28.5% | 31.2% |
| Range | 26.1% | 26.7% |
| Mean | 11.4% | 12.2% |
| Median | 10.4% | 11.7% |
| Interquartile 25% (IQ1) | 8.9% | 9.2% |
| Interquartile 75% (IQ3) | 14.2% | 13.6% |
| Interquartile Range (IQR) | 5.4% | 4.4% |
| Standard Deviation (Sample) | 4.7% | 5.1% |
| Standard Deviation (Population) | 4.6% | 5.0% |
Similar Demographics by Disability
Demographics Similar to Israelis by Disability
In terms of disability, the demographic groups most similar to Israelis are Immigrants from Nepal (10.8%, a difference of 0.050%), Immigrants from Japan (10.8%, a difference of 0.10%), Immigrants from Australia (10.8%, a difference of 0.15%), Cambodian (10.8%, a difference of 0.19%), and Mongolian (10.8%, a difference of 0.19%).
| Demographics | Rating | Rank | Disability |
| Ethiopians | 100.0 /100 | #36 | Exceptional 10.7% |
| Turks | 100.0 /100 | #37 | Exceptional 10.7% |
| Afghans | 99.9 /100 | #38 | Exceptional 10.8% |
| Cambodians | 99.9 /100 | #39 | Exceptional 10.8% |
| Mongolians | 99.9 /100 | #40 | Exceptional 10.8% |
| Immigrants | Australia | 99.9 /100 | #41 | Exceptional 10.8% |
| Immigrants | Nepal | 99.9 /100 | #42 | Exceptional 10.8% |
| Israelis | 99.9 /100 | #43 | Exceptional 10.8% |
| Immigrants | Japan | 99.9 /100 | #44 | Exceptional 10.8% |
| Immigrants | Peru | 99.9 /100 | #45 | Exceptional 10.8% |
| Tongans | 99.9 /100 | #46 | Exceptional 10.8% |
| Taiwanese | 99.9 /100 | #47 | Exceptional 10.8% |
| Soviet Union | 99.9 /100 | #48 | Exceptional 10.9% |
| Vietnamese | 99.9 /100 | #49 | Exceptional 10.9% |
| Immigrants | Saudi Arabia | 99.9 /100 | #50 | Exceptional 10.9% |
Demographics Similar to Syrians by Disability
In terms of disability, the demographic groups most similar to Syrians are Immigrants from Trinidad and Tobago (11.7%, a difference of 0.020%), Immigrants from Haiti (11.7%, a difference of 0.030%), Cuban (11.7%, a difference of 0.080%), Pakistani (11.7%, a difference of 0.17%), and Estonian (11.7%, a difference of 0.18%).
| Demographics | Rating | Rank | Disability |
| Immigrants | Middle Africa | 69.5 /100 | #157 | Good 11.6% |
| Armenians | 65.9 /100 | #158 | Good 11.6% |
| Guatemalans | 65.1 /100 | #159 | Good 11.6% |
| Immigrants | Barbados | 64.2 /100 | #160 | Good 11.6% |
| Immigrants | Cuba | 62.8 /100 | #161 | Good 11.6% |
| Immigrants | Haiti | 59.2 /100 | #162 | Average 11.7% |
| Immigrants | Trinidad and Tobago | 58.9 /100 | #163 | Average 11.7% |
| Syrians | 58.5 /100 | #164 | Average 11.7% |
| Cubans | 56.7 /100 | #165 | Average 11.7% |
| Pakistanis | 54.7 /100 | #166 | Average 11.7% |
| Estonians | 54.4 /100 | #167 | Average 11.7% |
| Immigrants | Latin America | 54.1 /100 | #168 | Average 11.7% |
| Immigrants | Austria | 53.4 /100 | #169 | Average 11.7% |
| Immigrants | Albania | 52.8 /100 | #170 | Average 11.7% |
| Immigrants | Southern Europe | 52.8 /100 | #171 | Average 11.7% |