Irish vs Yup'ik Vision Disability
COMPARE
Irish
Yup'ik
Vision Disability
Vision Disability Comparison
Irish
Yup'ik
2.3%
VISION DISABILITY
3.4/ 100
METRIC RATING
224th/ 347
METRIC RANK
2.7%
VISION DISABILITY
0.0/ 100
METRIC RATING
317th/ 347
METRIC RANK
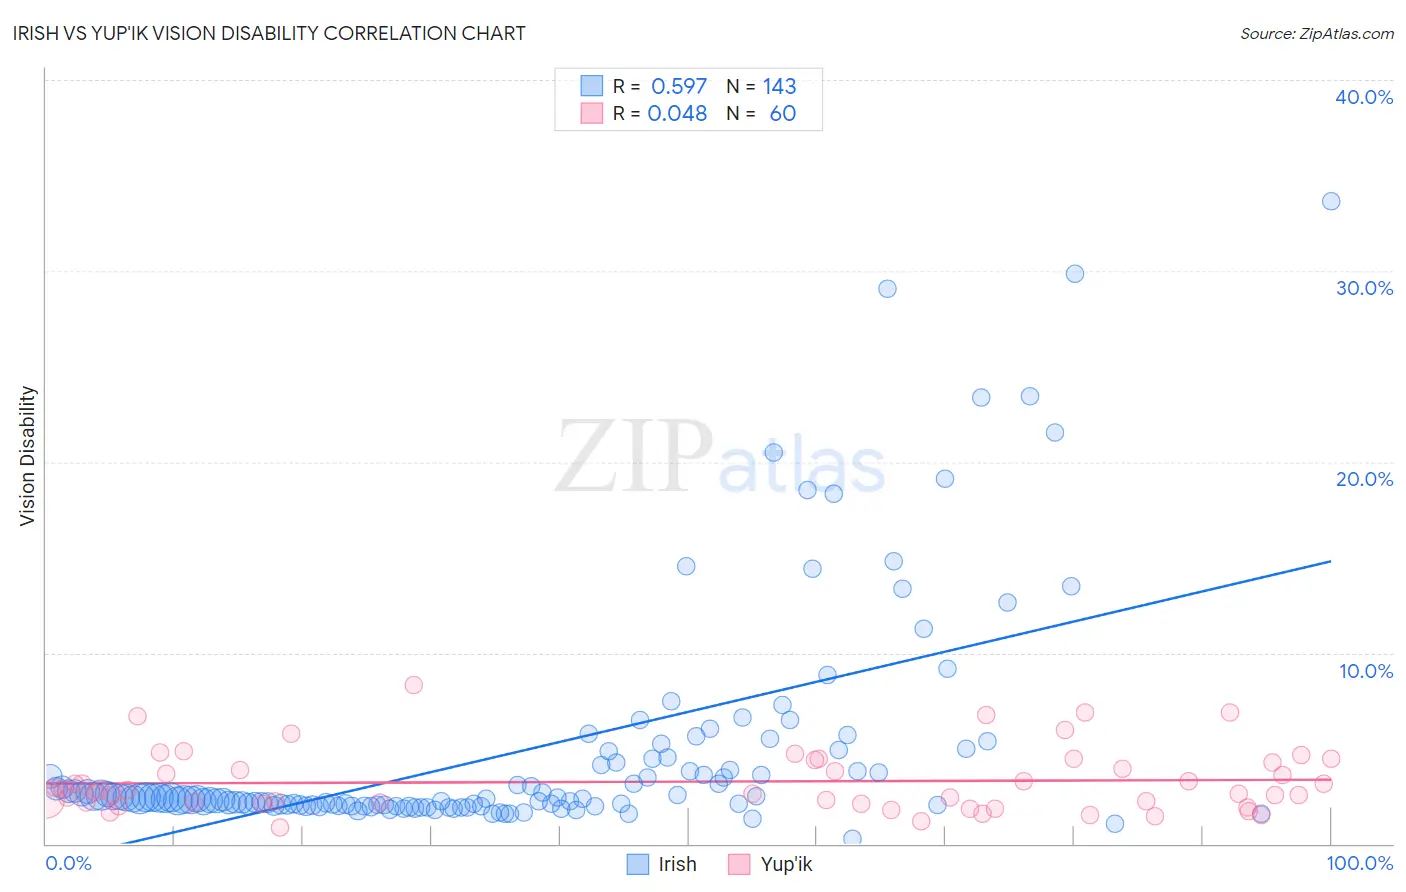
Irish vs Yup'ik Vision Disability Correlation Chart
The statistical analysis conducted on geographies consisting of 577,659,989 people shows a substantial positive correlation between the proportion of Irish and percentage of population with vision disability in the United States with a correlation coefficient (R) of 0.597 and weighted average of 2.3%. Similarly, the statistical analysis conducted on geographies consisting of 39,951,250 people shows no correlation between the proportion of Yup'ik and percentage of population with vision disability in the United States with a correlation coefficient (R) of 0.048 and weighted average of 2.7%, a difference of 18.4%.
Vision Disability Correlation Summary
| Measurement | Irish | Yup'ik |
| Minimum | 0.27% | 0.88% |
| Maximum | 33.6% | 8.3% |
| Range | 33.4% | 7.4% |
| Mean | 4.9% | 3.3% |
| Median | 2.4% | 2.7% |
| Interquartile 25% (IQ1) | 2.0% | 2.1% |
| Interquartile 75% (IQ3) | 4.4% | 4.3% |
| Interquartile Range (IQR) | 2.4% | 2.2% |
| Standard Deviation (Sample) | 6.0% | 1.6% |
| Standard Deviation (Population) | 6.0% | 1.6% |
Similar Demographics by Vision Disability
Demographics Similar to Irish by Vision Disability
In terms of vision disability, the demographic groups most similar to Irish are Immigrants from Western Africa (2.3%, a difference of 0.010%), Basque (2.3%, a difference of 0.020%), Immigrants from Senegal (2.3%, a difference of 0.17%), French Canadian (2.3%, a difference of 0.19%), and Guamanian/Chamorro (2.3%, a difference of 0.20%).
| Demographics | Rating | Rank | Vision Disability |
| Barbadians | 5.1 /100 | #217 | Tragic 2.3% |
| Portuguese | 4.9 /100 | #218 | Tragic 2.3% |
| Ecuadorians | 4.6 /100 | #219 | Tragic 2.3% |
| Guamanians/Chamorros | 3.9 /100 | #220 | Tragic 2.3% |
| French Canadians | 3.9 /100 | #221 | Tragic 2.3% |
| Immigrants | Senegal | 3.8 /100 | #222 | Tragic 2.3% |
| Basques | 3.5 /100 | #223 | Tragic 2.3% |
| Irish | 3.4 /100 | #224 | Tragic 2.3% |
| Immigrants | Western Africa | 3.4 /100 | #225 | Tragic 2.3% |
| Immigrants | Germany | 3.0 /100 | #226 | Tragic 2.3% |
| Hawaiians | 2.9 /100 | #227 | Tragic 2.3% |
| Hmong | 2.5 /100 | #228 | Tragic 2.3% |
| Welsh | 2.3 /100 | #229 | Tragic 2.3% |
| Nicaraguans | 2.2 /100 | #230 | Tragic 2.3% |
| Immigrants | Ecuador | 2.0 /100 | #231 | Tragic 2.3% |
Demographics Similar to Yup'ik by Vision Disability
In terms of vision disability, the demographic groups most similar to Yup'ik are Shoshone (2.7%, a difference of 0.20%), Osage (2.7%, a difference of 0.63%), Alaska Native (2.7%, a difference of 1.1%), Inupiat (2.7%, a difference of 1.8%), and Potawatomi (2.6%, a difference of 1.9%).
| Demographics | Rating | Rank | Vision Disability |
| Blackfeet | 0.0 /100 | #310 | Tragic 2.6% |
| Dominicans | 0.0 /100 | #311 | Tragic 2.6% |
| Americans | 0.0 /100 | #312 | Tragic 2.6% |
| Potawatomi | 0.0 /100 | #313 | Tragic 2.6% |
| Inupiat | 0.0 /100 | #314 | Tragic 2.7% |
| Osage | 0.0 /100 | #315 | Tragic 2.7% |
| Shoshone | 0.0 /100 | #316 | Tragic 2.7% |
| Yup'ik | 0.0 /100 | #317 | Tragic 2.7% |
| Alaska Natives | 0.0 /100 | #318 | Tragic 2.7% |
| Tohono O'odham | 0.0 /100 | #319 | Tragic 2.8% |
| Blacks/African Americans | 0.0 /100 | #320 | Tragic 2.8% |
| Comanche | 0.0 /100 | #321 | Tragic 2.8% |
| Paiute | 0.0 /100 | #322 | Tragic 2.9% |
| Tlingit-Haida | 0.0 /100 | #323 | Tragic 2.9% |
| Hopi | 0.0 /100 | #324 | Tragic 2.9% |