Crow vs Yup'ik Disability Age 5 to 17
COMPARE
Crow
Yup'ik
Disability Age 5 to 17
Disability Age 5 to 17 Comparison
Crow
Yup'ik
5.4%
DISABILITY AGE 5 TO 17
95.0/ 100
METRIC RATING
124th/ 347
METRIC RANK
4.8%
DISABILITY AGE 5 TO 17
100.0/ 100
METRIC RATING
21st/ 347
METRIC RANK
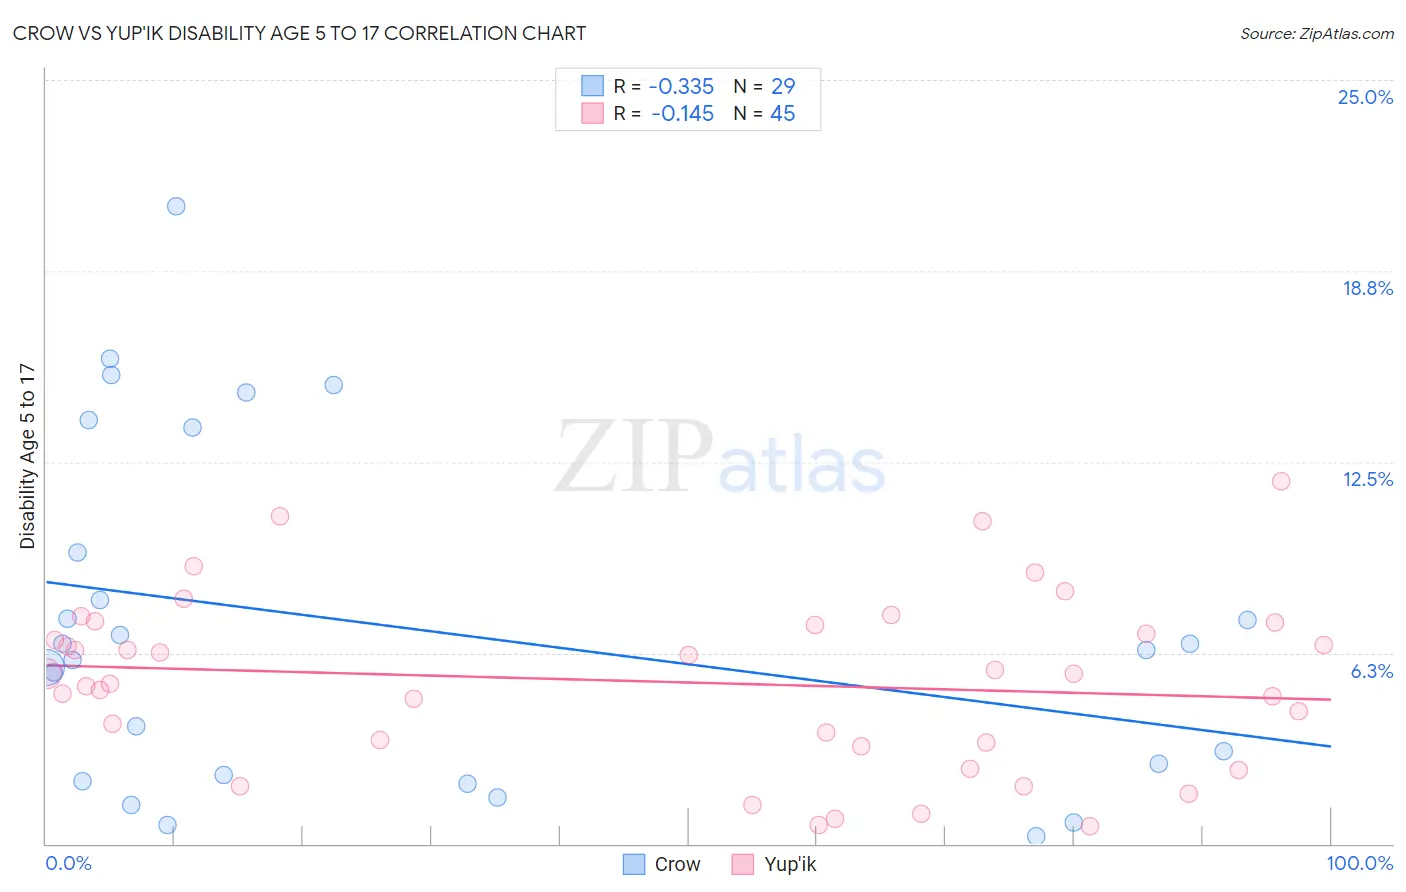
Crow vs Yup'ik Disability Age 5 to 17 Correlation Chart
The statistical analysis conducted on geographies consisting of 59,063,912 people shows a mild negative correlation between the proportion of Crow and percentage of population with a disability between the ages 5 and 17 in the United States with a correlation coefficient (R) of -0.335 and weighted average of 5.4%. Similarly, the statistical analysis conducted on geographies consisting of 39,814,891 people shows a poor negative correlation between the proportion of Yup'ik and percentage of population with a disability between the ages 5 and 17 in the United States with a correlation coefficient (R) of -0.145 and weighted average of 4.8%, a difference of 12.7%.
Disability Age 5 to 17 Correlation Summary
| Measurement | Crow | Yup'ik |
| Minimum | 0.26% | 0.58% |
| Maximum | 20.9% | 11.9% |
| Range | 20.6% | 11.3% |
| Mean | 7.1% | 5.3% |
| Median | 6.4% | 5.6% |
| Interquartile 25% (IQ1) | 2.1% | 3.3% |
| Interquartile 75% (IQ3) | 11.6% | 7.2% |
| Interquartile Range (IQR) | 9.4% | 3.9% |
| Standard Deviation (Sample) | 5.6% | 2.8% |
| Standard Deviation (Population) | 5.5% | 2.8% |
Similar Demographics by Disability Age 5 to 17
Demographics Similar to Crow by Disability Age 5 to 17
In terms of disability age 5 to 17, the demographic groups most similar to Crow are Immigrants from Chile (5.4%, a difference of 0.010%), New Zealander (5.4%, a difference of 0.020%), Latvian (5.4%, a difference of 0.030%), Immigrants from Ethiopia (5.4%, a difference of 0.13%), and Immigrants from Venezuela (5.4%, a difference of 0.14%).
| Demographics | Rating | Rank | Disability Age 5 to 17 |
| Immigrants | Afghanistan | 97.4 /100 | #117 | Exceptional 5.3% |
| South Americans | 97.1 /100 | #118 | Exceptional 5.4% |
| Immigrants | South America | 97.1 /100 | #119 | Exceptional 5.4% |
| Immigrants | Immigrants | 97.0 /100 | #120 | Exceptional 5.4% |
| Maltese | 96.0 /100 | #121 | Exceptional 5.4% |
| Chileans | 95.8 /100 | #122 | Exceptional 5.4% |
| Immigrants | Ethiopia | 95.5 /100 | #123 | Exceptional 5.4% |
| Crow | 95.0 /100 | #124 | Exceptional 5.4% |
| Immigrants | Chile | 95.0 /100 | #125 | Exceptional 5.4% |
| New Zealanders | 95.0 /100 | #126 | Exceptional 5.4% |
| Latvians | 95.0 /100 | #127 | Exceptional 5.4% |
| Immigrants | Venezuela | 94.5 /100 | #128 | Exceptional 5.4% |
| Romanians | 94.1 /100 | #129 | Exceptional 5.4% |
| Immigrants | Bulgaria | 94.0 /100 | #130 | Exceptional 5.4% |
| Arabs | 92.9 /100 | #131 | Exceptional 5.4% |
Demographics Similar to Yup'ik by Disability Age 5 to 17
In terms of disability age 5 to 17, the demographic groups most similar to Yup'ik are Burmese (4.8%, a difference of 0.22%), Asian (4.8%, a difference of 0.34%), Immigrants from Uzbekistan (4.8%, a difference of 0.60%), Immigrants from Bolivia (4.8%, a difference of 1.0%), and Immigrants from South Central Asia (4.7%, a difference of 1.1%).
| Demographics | Rating | Rank | Disability Age 5 to 17 |
| Immigrants | Korea | 100.0 /100 | #14 | Exceptional 4.7% |
| Chinese | 100.0 /100 | #15 | Exceptional 4.7% |
| Immigrants | Singapore | 100.0 /100 | #16 | Exceptional 4.7% |
| Arapaho | 100.0 /100 | #17 | Exceptional 4.7% |
| Immigrants | South Central Asia | 100.0 /100 | #18 | Exceptional 4.7% |
| Immigrants | Uzbekistan | 100.0 /100 | #19 | Exceptional 4.8% |
| Burmese | 100.0 /100 | #20 | Exceptional 4.8% |
| Yup'ik | 100.0 /100 | #21 | Exceptional 4.8% |
| Asians | 100.0 /100 | #22 | Exceptional 4.8% |
| Immigrants | Bolivia | 100.0 /100 | #23 | Exceptional 4.8% |
| Immigrants | Lebanon | 100.0 /100 | #24 | Exceptional 4.8% |
| Immigrants | Asia | 100.0 /100 | #25 | Exceptional 4.8% |
| Bhutanese | 100.0 /100 | #26 | Exceptional 4.9% |
| Taiwanese | 100.0 /100 | #27 | Exceptional 4.9% |
| Immigrants | Japan | 100.0 /100 | #28 | Exceptional 4.9% |