Irish vs Immigrants from Panama Cognitive Disability
COMPARE
Irish
Immigrants from Panama
Cognitive Disability
Cognitive Disability Comparison
Irish
Immigrants from Panama
16.8%
COGNITIVE DISABILITY
98.1/ 100
METRIC RATING
102nd/ 347
METRIC RANK
17.5%
COGNITIVE DISABILITY
14.8/ 100
METRIC RATING
198th/ 347
METRIC RANK
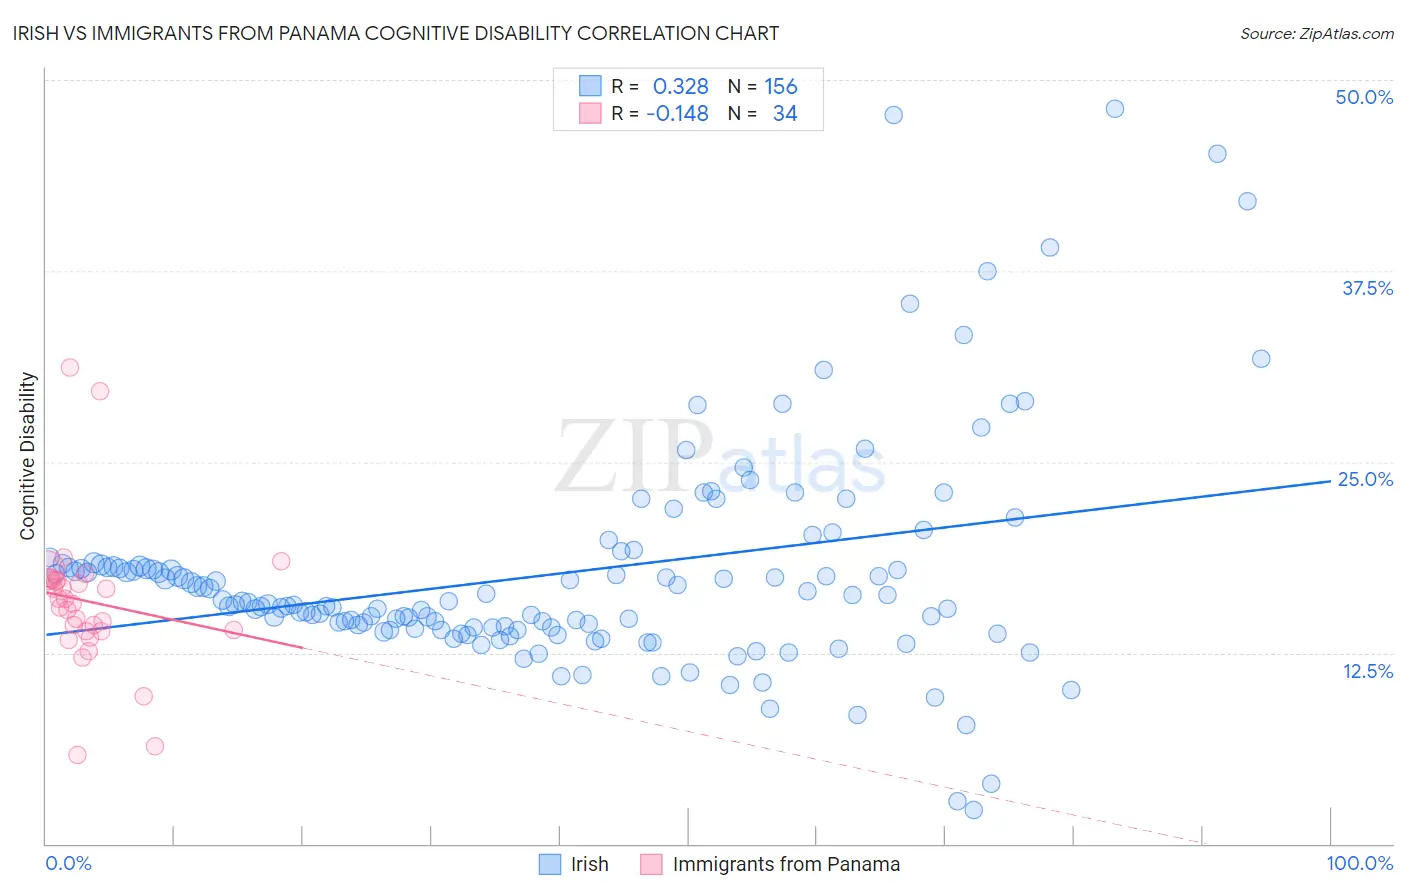
Irish vs Immigrants from Panama Cognitive Disability Correlation Chart
The statistical analysis conducted on geographies consisting of 580,428,608 people shows a mild positive correlation between the proportion of Irish and percentage of population with cognitive disability in the United States with a correlation coefficient (R) of 0.328 and weighted average of 16.8%. Similarly, the statistical analysis conducted on geographies consisting of 221,178,303 people shows a poor negative correlation between the proportion of Immigrants from Panama and percentage of population with cognitive disability in the United States with a correlation coefficient (R) of -0.148 and weighted average of 17.5%, a difference of 4.2%.
Cognitive Disability Correlation Summary
| Measurement | Irish | Immigrants from Panama |
| Minimum | 2.2% | 5.8% |
| Maximum | 48.1% | 31.2% |
| Range | 45.9% | 25.4% |
| Mean | 17.7% | 15.9% |
| Median | 15.8% | 15.9% |
| Interquartile 25% (IQ1) | 14.1% | 13.9% |
| Interquartile 75% (IQ3) | 18.1% | 17.3% |
| Interquartile Range (IQR) | 4.0% | 3.3% |
| Standard Deviation (Sample) | 7.3% | 4.8% |
| Standard Deviation (Population) | 7.2% | 4.7% |
Similar Demographics by Cognitive Disability
Demographics Similar to Irish by Cognitive Disability
In terms of cognitive disability, the demographic groups most similar to Irish are Immigrants from Russia (16.8%, a difference of 0.030%), Immigrants from Asia (16.8%, a difference of 0.030%), Paraguayan (16.8%, a difference of 0.050%), Palestinian (16.8%, a difference of 0.050%), and Jordanian (16.8%, a difference of 0.060%).
| Demographics | Rating | Rank | Cognitive Disability |
| English | 98.6 /100 | #95 | Exceptional 16.8% |
| Finns | 98.5 /100 | #96 | Exceptional 16.8% |
| Dutch | 98.5 /100 | #97 | Exceptional 16.8% |
| Immigrants | Lebanon | 98.4 /100 | #98 | Exceptional 16.8% |
| Jordanians | 98.2 /100 | #99 | Exceptional 16.8% |
| Immigrants | Russia | 98.2 /100 | #100 | Exceptional 16.8% |
| Immigrants | Asia | 98.1 /100 | #101 | Exceptional 16.8% |
| Irish | 98.1 /100 | #102 | Exceptional 16.8% |
| Paraguayans | 98.0 /100 | #103 | Exceptional 16.8% |
| Palestinians | 98.0 /100 | #104 | Exceptional 16.8% |
| Immigrants | Eastern Asia | 97.9 /100 | #105 | Exceptional 16.8% |
| Northern Europeans | 97.8 /100 | #106 | Exceptional 16.8% |
| Immigrants | Nicaragua | 97.8 /100 | #107 | Exceptional 16.8% |
| Canadians | 97.5 /100 | #108 | Exceptional 16.8% |
| Albanians | 97.3 /100 | #109 | Exceptional 16.8% |
Demographics Similar to Immigrants from Panama by Cognitive Disability
In terms of cognitive disability, the demographic groups most similar to Immigrants from Panama are Immigrants from Singapore (17.5%, a difference of 0.030%), Haitian (17.5%, a difference of 0.040%), Immigrants from Afghanistan (17.5%, a difference of 0.10%), South American Indian (17.5%, a difference of 0.11%), and Guyanese (17.5%, a difference of 0.14%).
| Demographics | Rating | Rank | Cognitive Disability |
| Immigrants | Nonimmigrants | 27.4 /100 | #191 | Fair 17.4% |
| Immigrants | Haiti | 27.1 /100 | #192 | Fair 17.4% |
| Delaware | 25.6 /100 | #193 | Fair 17.4% |
| Immigrants | Bosnia and Herzegovina | 22.0 /100 | #194 | Fair 17.4% |
| New Zealanders | 21.1 /100 | #195 | Fair 17.4% |
| Guyanese | 17.5 /100 | #196 | Poor 17.5% |
| Immigrants | Afghanistan | 16.7 /100 | #197 | Poor 17.5% |
| Immigrants | Panama | 14.8 /100 | #198 | Poor 17.5% |
| Immigrants | Singapore | 14.3 /100 | #199 | Poor 17.5% |
| Haitians | 14.1 /100 | #200 | Poor 17.5% |
| South American Indians | 13.0 /100 | #201 | Poor 17.5% |
| Immigrants | Morocco | 12.0 /100 | #202 | Poor 17.5% |
| Immigrants | Caribbean | 11.0 /100 | #203 | Poor 17.5% |
| Immigrants | Zimbabwe | 11.0 /100 | #204 | Poor 17.5% |
| Puget Sound Salish | 10.9 /100 | #205 | Poor 17.5% |