Irish vs Immigrants from Norway Cognitive Disability
COMPARE
Irish
Immigrants from Norway
Cognitive Disability
Cognitive Disability Comparison
Irish
Immigrants from Norway
16.8%
COGNITIVE DISABILITY
98.1/ 100
METRIC RATING
102nd/ 347
METRIC RANK
17.0%
COGNITIVE DISABILITY
90.9/ 100
METRIC RATING
137th/ 347
METRIC RANK
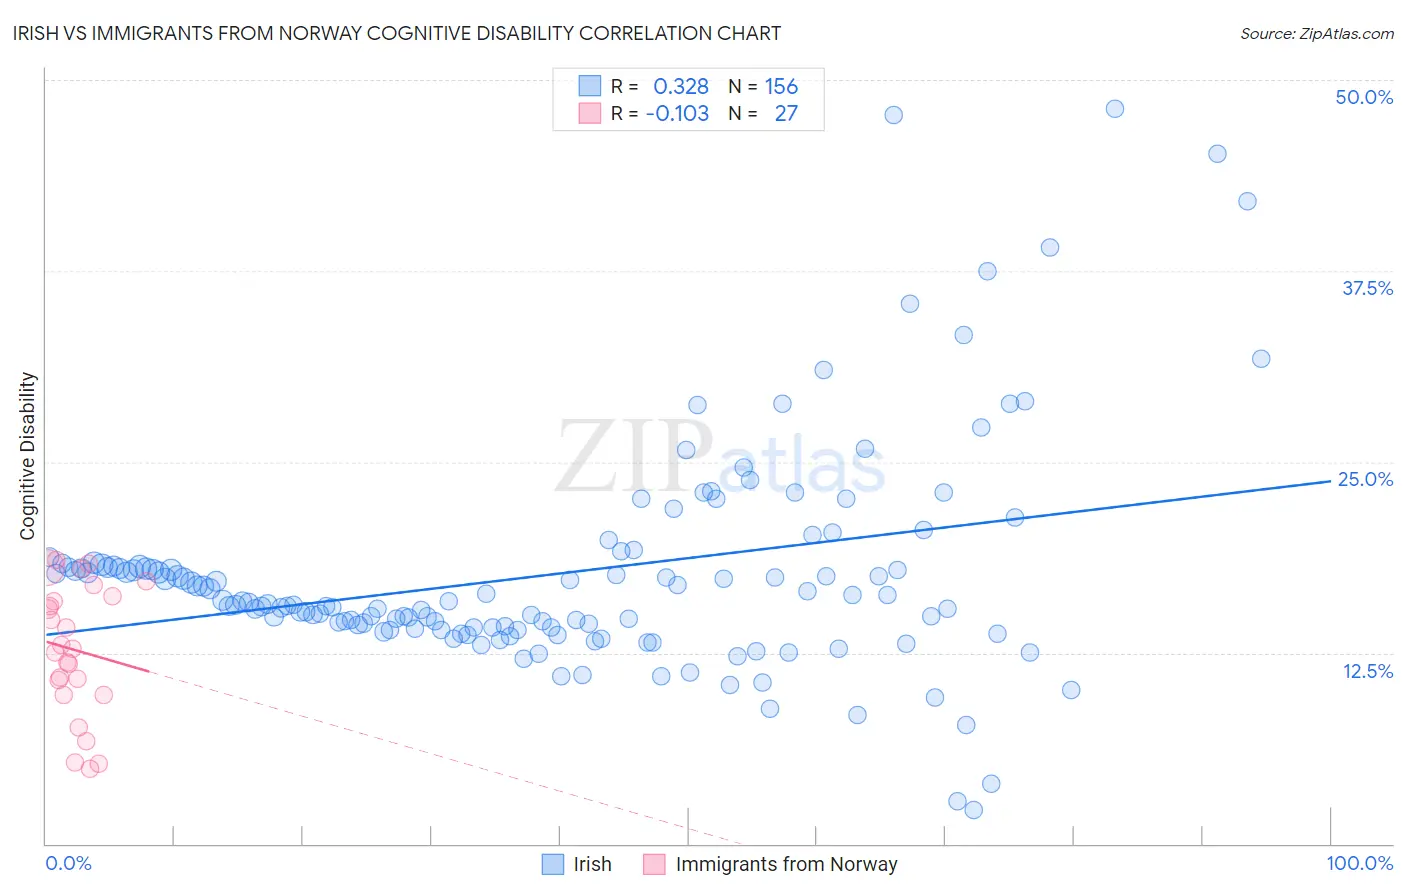
Irish vs Immigrants from Norway Cognitive Disability Correlation Chart
The statistical analysis conducted on geographies consisting of 580,428,608 people shows a mild positive correlation between the proportion of Irish and percentage of population with cognitive disability in the United States with a correlation coefficient (R) of 0.328 and weighted average of 16.8%. Similarly, the statistical analysis conducted on geographies consisting of 116,706,385 people shows a poor negative correlation between the proportion of Immigrants from Norway and percentage of population with cognitive disability in the United States with a correlation coefficient (R) of -0.103 and weighted average of 17.0%, a difference of 1.2%.
Cognitive Disability Correlation Summary
| Measurement | Irish | Immigrants from Norway |
| Minimum | 2.2% | 4.9% |
| Maximum | 48.1% | 18.5% |
| Range | 45.9% | 13.7% |
| Mean | 17.7% | 12.7% |
| Median | 15.8% | 12.7% |
| Interquartile 25% (IQ1) | 14.1% | 9.7% |
| Interquartile 75% (IQ3) | 18.1% | 16.2% |
| Interquartile Range (IQR) | 4.0% | 6.5% |
| Standard Deviation (Sample) | 7.3% | 4.2% |
| Standard Deviation (Population) | 7.2% | 4.2% |
Similar Demographics by Cognitive Disability
Demographics Similar to Irish by Cognitive Disability
In terms of cognitive disability, the demographic groups most similar to Irish are Immigrants from Russia (16.8%, a difference of 0.030%), Immigrants from Asia (16.8%, a difference of 0.030%), Paraguayan (16.8%, a difference of 0.050%), Palestinian (16.8%, a difference of 0.050%), and Jordanian (16.8%, a difference of 0.060%).
| Demographics | Rating | Rank | Cognitive Disability |
| English | 98.6 /100 | #95 | Exceptional 16.8% |
| Finns | 98.5 /100 | #96 | Exceptional 16.8% |
| Dutch | 98.5 /100 | #97 | Exceptional 16.8% |
| Immigrants | Lebanon | 98.4 /100 | #98 | Exceptional 16.8% |
| Jordanians | 98.2 /100 | #99 | Exceptional 16.8% |
| Immigrants | Russia | 98.2 /100 | #100 | Exceptional 16.8% |
| Immigrants | Asia | 98.1 /100 | #101 | Exceptional 16.8% |
| Irish | 98.1 /100 | #102 | Exceptional 16.8% |
| Paraguayans | 98.0 /100 | #103 | Exceptional 16.8% |
| Palestinians | 98.0 /100 | #104 | Exceptional 16.8% |
| Immigrants | Eastern Asia | 97.9 /100 | #105 | Exceptional 16.8% |
| Northern Europeans | 97.8 /100 | #106 | Exceptional 16.8% |
| Immigrants | Nicaragua | 97.8 /100 | #107 | Exceptional 16.8% |
| Canadians | 97.5 /100 | #108 | Exceptional 16.8% |
| Albanians | 97.3 /100 | #109 | Exceptional 16.8% |
Demographics Similar to Immigrants from Norway by Cognitive Disability
In terms of cognitive disability, the demographic groups most similar to Immigrants from Norway are Israeli (17.0%, a difference of 0.0%), Welsh (17.0%, a difference of 0.020%), Lebanese (17.0%, a difference of 0.030%), Immigrants from Chile (17.0%, a difference of 0.070%), and French (17.0%, a difference of 0.080%).
| Demographics | Rating | Rank | Cognitive Disability |
| Immigrants | Vietnam | 92.4 /100 | #130 | Exceptional 17.0% |
| Immigrants | Germany | 92.1 /100 | #131 | Exceptional 17.0% |
| Whites/Caucasians | 92.1 /100 | #132 | Exceptional 17.0% |
| Immigrants | Jordan | 91.9 /100 | #133 | Exceptional 17.0% |
| Immigrants | Chile | 91.7 /100 | #134 | Exceptional 17.0% |
| Lebanese | 91.3 /100 | #135 | Exceptional 17.0% |
| Israelis | 91.0 /100 | #136 | Exceptional 17.0% |
| Immigrants | Norway | 90.9 /100 | #137 | Exceptional 17.0% |
| Welsh | 90.8 /100 | #138 | Exceptional 17.0% |
| French | 90.0 /100 | #139 | Excellent 17.0% |
| Chileans | 89.9 /100 | #140 | Excellent 17.0% |
| Aleuts | 89.9 /100 | #141 | Excellent 17.0% |
| Carpatho Rusyns | 89.6 /100 | #142 | Excellent 17.0% |
| British | 89.3 /100 | #143 | Excellent 17.0% |
| Immigrants | Brazil | 89.3 /100 | #144 | Excellent 17.0% |