Irish vs Nicaraguan Child Poverty Under the Age of 16

COMPARE

Irish
Race
Ancestry
AfghanAfricanAlaska NativeAlaskan AthabascanAlbanianAleutAlsatianAmericanApacheArabArapahoArgentineanArmenianAssyrian/Chaldean/SyriacAustralianAustrianBahamianBangladeshiBarbadianBasqueBelgianBelizeanBermudanBhutaneseBlackfeetBolivianBrazilianBritishBritish West IndianBulgarianBurmeseCajunCambodianCanadianCape VerdeanCarpatho RusynCelticCentral AmericanCentral American IndianCherokeeCheyenneChickasawChileanChineseChippewaChoctawColombianColvilleComancheCosta RicanCreeCreekCroatianCrowCubanCypriotCzechCzechoslovakianDanishDelawareDominicanDutchDutch West IndianEastern EuropeanEcuadorianEgyptianEnglishEstonianEthiopianEuropeanFijianFilipinoFinnishFrenchFrench American IndianFrench CanadianGermanGerman RussianGhanaianGreekGuamanian/ChamorroGuatemalanGuyaneseHaitianHmongHonduranHopiHoumaHungarianIcelanderIndian (Asian)IndonesianInupiatIranianIraqiIrishIroquoisIsraeliItalianJamaicanJapaneseJordanianKenyanKiowaKoreanLaotianLatvianLebaneseLiberianLithuanianLumbeeLuxembourgerMacedonianMalaysianMalteseMarshalleseMenomineeMexicanMexican American IndianMongolianMoroccanNative HawaiianNavajoNepaleseNew ZealanderNigerianNorthern EuropeanNorwegianOkinawanOsageOttawaPaiutePakistaniPalestinianPanamanianParaguayanPennsylvania GermanPeruvianPimaPolishPortuguesePotawatomiPuebloPuerto RicanPuget Sound SalishRomanianRussianSalvadoranSamoanScandinavianScotch-IrishScottishSeminoleSenegaleseSerbianShoshoneSierra LeoneanSiouxSlavicSlovakSloveneSomaliSouth AfricanSouth AmericanSouth American IndianSoviet UnionSpaniardSpanishSpanish AmericanSpanish American IndianSri LankanSubsaharan AfricanSudaneseSwedishSwissSyrianTaiwaneseThaiTlingit-HaidaTohono O'OdhamTonganTrinidadian and TobagonianTsimshianTurkishU.S. Virgin IslanderUgandanUkrainianUruguayanUteVenezuelanVietnameseWelshWest IndianYakamaYaquiYugoslavianYumanYup'ikZimbabwean
Immigration
NonimmigrantsImmigrantsAfghanistanAfricaAlbaniaArgentinaArmeniaAsiaAustraliaAustriaBahamasBangladeshBarbadosBelarusBelgiumBelizeBoliviaBosnia and HerzegovinaBrazilBulgariaBurma/MyanmarCabo VerdeCambodiaCameroonCanadaCaribbeanCentral AmericaChileChinaColombiaCongoCosta RicaCroatiaCubaCzechoslovakiaDenmarkDominicaDominican RepublicEastern AfricaEastern AsiaEastern EuropeEcuadorEgyptEl SalvadorEnglandEritreaEthiopiaEuropeFijiFranceGermanyGhanaGreeceGrenadaGuatemalaGuyanaHaitiHondurasHong KongHungaryIndiaIndonesiaIranIraqIrelandIsraelItalyJamaicaJapanJordanKazakhstanKenyaKoreaKuwaitLaosLatin AmericaLatviaLebanonLiberiaLithuaniaMalaysiaMexicoMicronesiaMiddle AfricaMoldovaMoroccoNepalNetherlandsNicaraguaNigeriaNorth AmericaNorth MacedoniaNorthern AfricaNorthern EuropeNorwayOceaniaPakistanPanamaPeruPhilippinesPolandPortugalRomaniaRussiaSaudi ArabiaScotlandSenegalSerbiaSierra LeoneSingaporeSomaliaSouth AfricaSouth AmericaSouth Central AsiaSouth Eastern AsiaSouthern EuropeSpainSri LankaSt. Vincent and the GrenadinesSudanSwedenSwitzerlandSyriaTaiwanThailandTrinidad and TobagoTurkeyUgandaUkraineUruguayUzbekistanVenezuelaVietnamWest IndiesWestern AfricaWestern AsiaWestern EuropeYemenZaireZimbabweAzores
Nicaraguan
Race
Ancestry
AfghanAfricanAlaska NativeAlaskan AthabascanAlbanianAleutAlsatianAmericanApacheArabArapahoArgentineanArmenianAssyrian/Chaldean/SyriacAustralianAustrianBahamianBangladeshiBarbadianBasqueBelgianBelizeanBermudanBhutaneseBlackfeetBolivianBrazilianBritishBritish West IndianBulgarianBurmeseCajunCambodianCanadianCape VerdeanCarpatho RusynCelticCentral AmericanCentral American IndianCherokeeCheyenneChickasawChileanChineseChippewaChoctawColombianColvilleComancheCosta RicanCreeCreekCroatianCrowCubanCypriotCzechCzechoslovakianDanishDelawareDominicanDutchDutch West IndianEastern EuropeanEcuadorianEgyptianEnglishEstonianEthiopianEuropeanFijianFilipinoFinnishFrenchFrench American IndianFrench CanadianGermanGerman RussianGhanaianGreekGuamanian/ChamorroGuatemalanGuyaneseHaitianHmongHonduranHopiHoumaHungarianIcelanderIndian (Asian)IndonesianInupiatIranianIraqiIroquoisIsraeliItalianJamaicanJapaneseJordanianKenyanKiowaKoreanLaotianLatvianLebaneseLiberianLithuanianLumbeeLuxembourgerMacedonianMalaysianMalteseMarshalleseMenomineeMexicanMexican American IndianMongolianMoroccanNative HawaiianNavajoNepaleseNew ZealanderNicaraguanNigerianNorthern EuropeanNorwegianOkinawanOsageOttawaPaiutePakistaniPalestinianPanamanianParaguayanPennsylvania GermanPeruvianPimaPolishPortuguesePotawatomiPuebloPuerto RicanPuget Sound SalishRomanianRussianSalvadoranSamoanScandinavianScotch-IrishScottishSeminoleSenegaleseSerbianShoshoneSierra LeoneanSiouxSlavicSlovakSloveneSomaliSouth AfricanSouth AmericanSouth American IndianSoviet UnionSpaniardSpanishSpanish AmericanSpanish American IndianSri LankanSubsaharan AfricanSudaneseSwedishSwissSyrianTaiwaneseThaiTlingit-HaidaTohono O'OdhamTonganTrinidadian and TobagonianTsimshianTurkishU.S. Virgin IslanderUgandanUkrainianUruguayanUteVenezuelanVietnameseWelshWest IndianYakamaYaquiYugoslavianYumanYup'ikZimbabwean
Immigration
NonimmigrantsImmigrantsAfghanistanAfricaAlbaniaArgentinaArmeniaAsiaAustraliaAustriaBahamasBangladeshBarbadosBelarusBelgiumBelizeBoliviaBosnia and HerzegovinaBrazilBulgariaBurma/MyanmarCabo VerdeCambodiaCameroonCanadaCaribbeanCentral AmericaChileChinaColombiaCongoCosta RicaCroatiaCubaCzechoslovakiaDenmarkDominicaDominican RepublicEastern AfricaEastern AsiaEastern EuropeEcuadorEgyptEl SalvadorEnglandEritreaEthiopiaEuropeFijiFranceGermanyGhanaGreeceGrenadaGuatemalaGuyanaHaitiHondurasHong KongHungaryIndiaIndonesiaIranIraqIrelandIsraelItalyJamaicaJapanJordanKazakhstanKenyaKoreaKuwaitLaosLatin AmericaLatviaLebanonLiberiaLithuaniaMalaysiaMexicoMicronesiaMiddle AfricaMoldovaMoroccoNepalNetherlandsNicaraguaNigeriaNorth AmericaNorth MacedoniaNorthern AfricaNorthern EuropeNorwayOceaniaPakistanPanamaPeruPhilippinesPolandPortugalRomaniaRussiaSaudi ArabiaScotlandSenegalSerbiaSierra LeoneSingaporeSomaliaSouth AfricaSouth AmericaSouth Central AsiaSouth Eastern AsiaSouthern EuropeSpainSri LankaSt. Vincent and the GrenadinesSudanSwedenSwitzerlandSyriaTaiwanThailandTrinidad and TobagoTurkeyUgandaUkraineUruguayUzbekistanVenezuelaVietnamWest IndiesWestern AfricaWestern AsiaWestern EuropeYemenZaireZimbabweAzores
Child Poverty Under the Age of 16
Income
Poverty
Unemployment
Labor Participation
Family Structure
Vehicle Availability
Education Level
Disability

Child Poverty Under the Age of 16 Comparison

Irish

Nicaraguans

Exceptional
Tragic
14.9%
CHILD POVERTY UNDER THE AGE OF 16
93.4/ 100
METRIC RATING
112th/ 347
METRIC RANK
18.2%
CHILD POVERTY UNDER THE AGE OF 16
1.7/ 100
METRIC RATING
231st/ 347
METRIC RANK

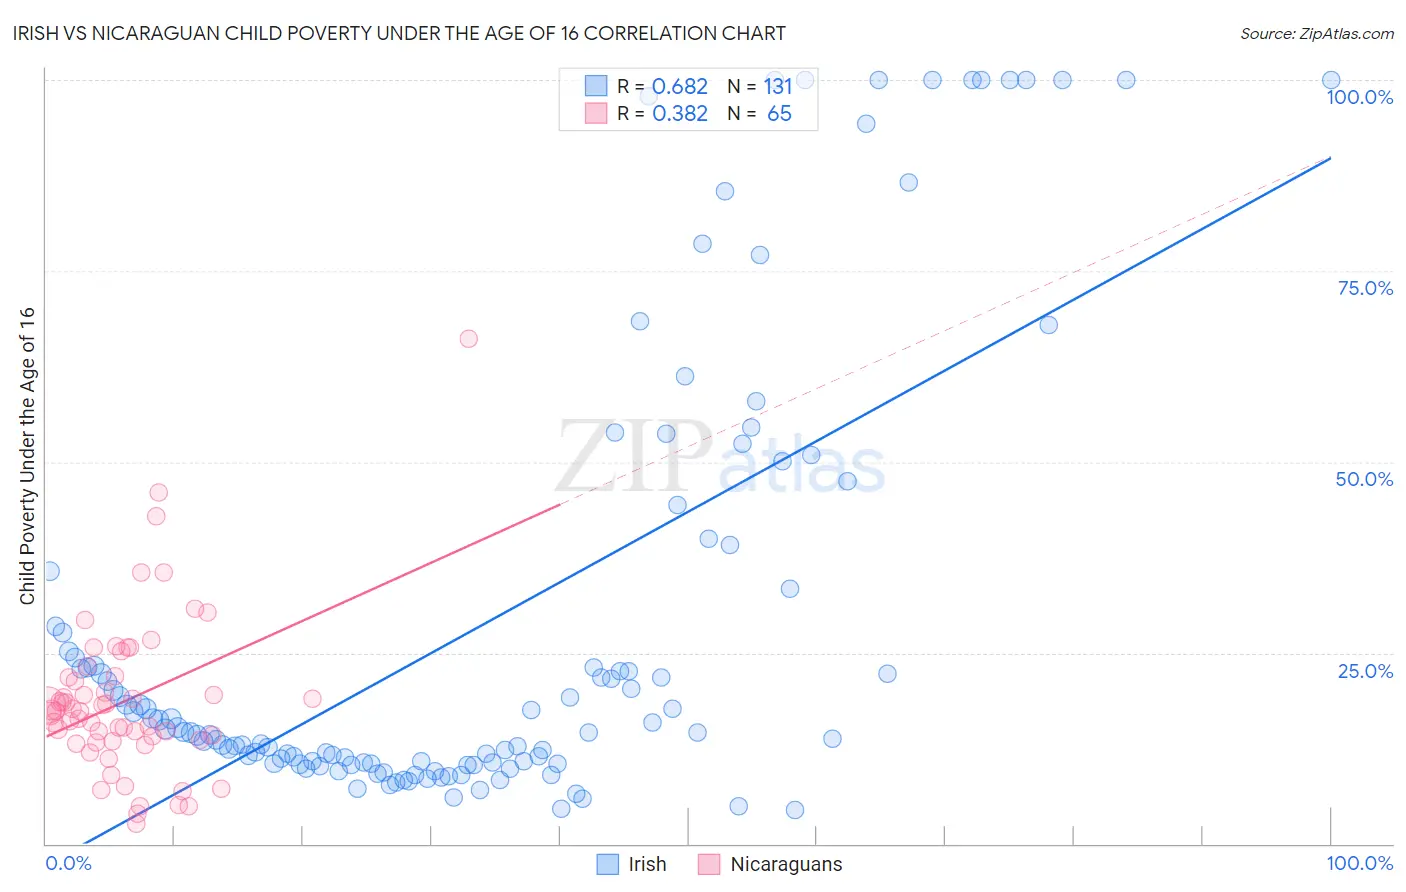
Irish vs Nicaraguan Child Poverty Under the Age of 16 Correlation Chart

The statistical analysis conducted on geographies consisting of 565,748,670 people shows a significant positive correlation between the proportion of Irish and poverty level among children under the age of 16 in the United States with a correlation coefficient (R) of 0.682 and weighted average of 14.9%. Similarly, the statistical analysis conducted on geographies consisting of 284,786,124 people shows a mild positive correlation between the proportion of Nicaraguans and poverty level among children under the age of 16 in the United States with a correlation coefficient (R) of 0.382 and weighted average of 18.2%, a difference of 21.8%.
Irish vs Nicaraguan Child Poverty Under the Age of 16

Child Poverty Under the Age of 16 Correlation Summary

MeasurementIrishNicaraguan
Minimum4.5%2.6%
Maximum100.0%66.2%
Range95.5%63.6%
Mean28.8%18.7%
Median14.6%17.4%
Interquartile 25% (IQ1)10.6%13.5%
Interquartile 75% (IQ3)33.4%21.8%
Interquartile Range (IQR)22.9%8.3%
Standard Deviation (Sample)29.2%10.4%
Standard Deviation (Population)29.1%10.4%

Similar Demographics by Child Poverty Under the Age of 16

Demographics Similar to Irish by Child Poverty Under the Age of 16

In terms of child poverty under the age of 16, the demographic groups most similar to Irish are Belgian (14.9%, a difference of 0.040%), Immigrants from Denmark (14.9%, a difference of 0.060%), English (14.9%, a difference of 0.070%), Sri Lankan (14.9%, a difference of 0.070%), and Immigrants from Ukraine (14.9%, a difference of 0.13%).
DemographicsRating | RankChild Poverty Under the Age of 16
Basques
94.7
/100
|
#105
Exceptional
14.8%
Serbians
94.5
/100
|
#106
Exceptional
14.8%
Chileans
94.4
/100
|
#107
Exceptional
14.8%
Jordanians
94.2
/100
|
#108
Exceptional
14.8%
Tlingit-Haida
94.1
/100
|
#109
Exceptional
14.9%
English
93.5
/100
|
#110
Exceptional
14.9%
Immigrants | Denmark
93.5
/100
|
#111
Exceptional
14.9%
Irish
93.4
/100
|
#112
Exceptional
14.9%
Belgians
93.3
/100
|
#113
Exceptional
14.9%
Sri Lankans
93.2
/100
|
#114
Exceptional
14.9%
Immigrants | Ukraine
93.1
/100
|
#115
Exceptional
14.9%
Carpatho Rusyns
93.1
/100
|
#116
Exceptional
14.9%
Immigrants | Norway
92.8
/100
|
#117
Exceptional
15.0%
Immigrants | Malaysia
92.6
/100
|
#118
Exceptional
15.0%
Scottish
92.3
/100
|
#119
Exceptional
15.0%

Demographics Similar to Nicaraguans by Child Poverty Under the Age of 16

In terms of child poverty under the age of 16, the demographic groups most similar to Nicaraguans are Nepalese (18.2%, a difference of 0.060%), Marshallese (18.1%, a difference of 0.14%), Immigrants from Micronesia (18.0%, a difference of 0.87%), American (18.3%, a difference of 0.90%), and Immigrants from Africa (18.0%, a difference of 1.0%).
DemographicsRating | RankChild Poverty Under the Age of 16
Osage
3.1
/100
|
#224
Tragic
17.9%
Immigrants | Nonimmigrants
2.7
/100
|
#225
Tragic
17.9%
Bermudans
2.6
/100
|
#226
Tragic
18.0%
Immigrants | Africa
2.5
/100
|
#227
Tragic
18.0%
Immigrants | Micronesia
2.3
/100
|
#228
Tragic
18.0%
Marshallese
1.8
/100
|
#229
Tragic
18.1%
Nepalese
1.7
/100
|
#230
Tragic
18.2%
Nicaraguans
1.7
/100
|
#231
Tragic
18.2%
Americans
1.2
/100
|
#232
Tragic
18.3%
Fijians
1.1
/100
|
#233
Tragic
18.4%
Immigrants | Nigeria
1.0
/100
|
#234
Tragic
18.4%
Nigerians
1.0
/100
|
#235
Tragic
18.4%
Cree
0.9
/100
|
#236
Tragic
18.5%
Sudanese
0.9
/100
|
#237
Tragic
18.5%
Immigrants | Eritrea
0.8
/100
|
#238
Tragic
18.5%