Irish vs Chickasaw Cognitive Disability
COMPARE
Irish
Chickasaw
Cognitive Disability
Cognitive Disability Comparison
Irish
Chickasaw
16.8%
COGNITIVE DISABILITY
98.1/ 100
METRIC RATING
102nd/ 347
METRIC RANK
18.5%
COGNITIVE DISABILITY
0.0/ 100
METRIC RATING
312th/ 347
METRIC RANK
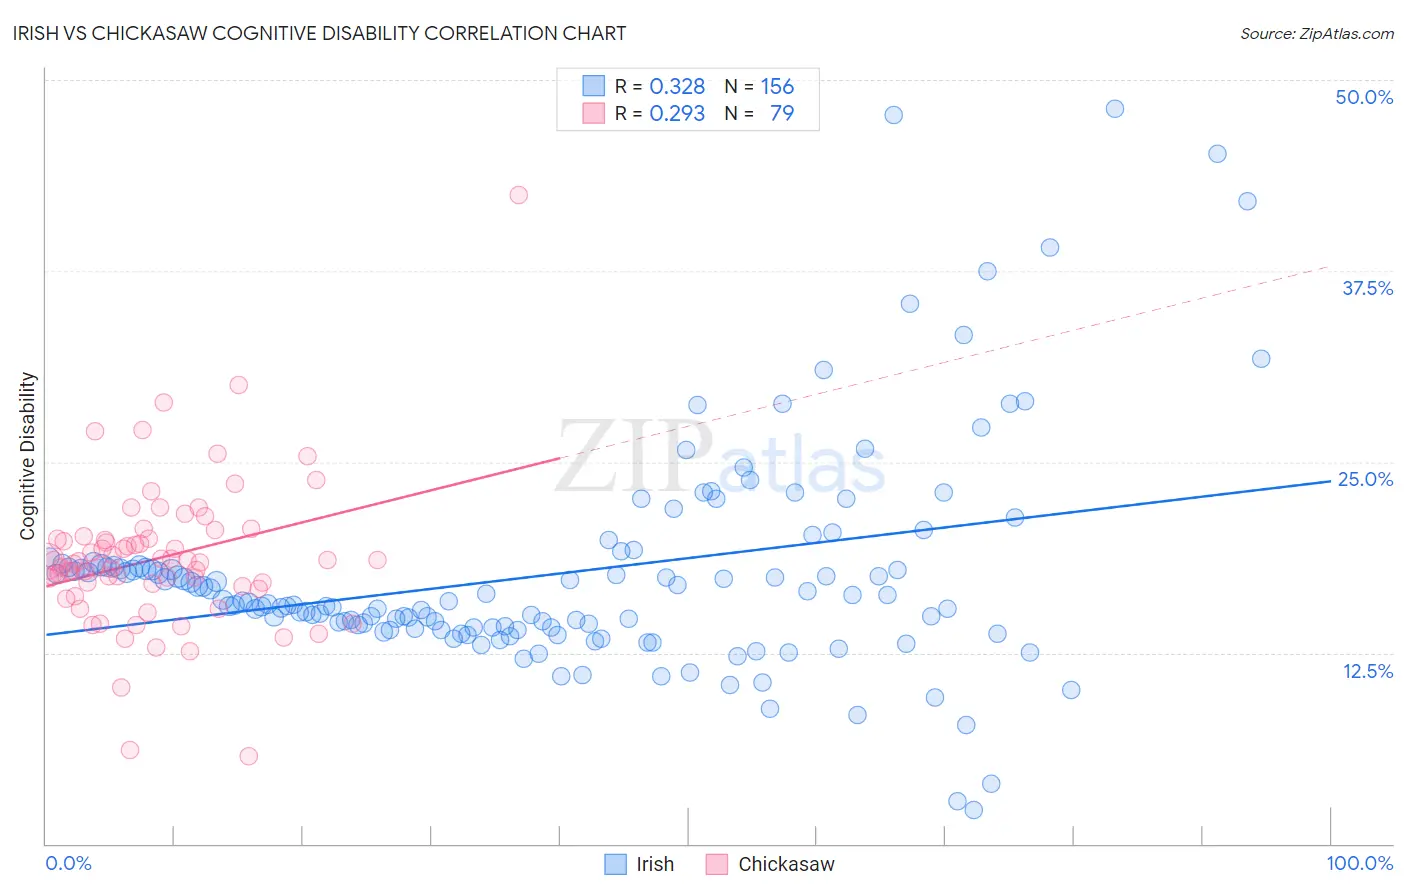
Irish vs Chickasaw Cognitive Disability Correlation Chart
The statistical analysis conducted on geographies consisting of 580,428,608 people shows a mild positive correlation between the proportion of Irish and percentage of population with cognitive disability in the United States with a correlation coefficient (R) of 0.328 and weighted average of 16.8%. Similarly, the statistical analysis conducted on geographies consisting of 147,689,565 people shows a weak positive correlation between the proportion of Chickasaw and percentage of population with cognitive disability in the United States with a correlation coefficient (R) of 0.293 and weighted average of 18.5%, a difference of 10.1%.
Cognitive Disability Correlation Summary
| Measurement | Irish | Chickasaw |
| Minimum | 2.2% | 5.7% |
| Maximum | 48.1% | 42.5% |
| Range | 45.9% | 36.8% |
| Mean | 17.7% | 18.7% |
| Median | 15.8% | 18.5% |
| Interquartile 25% (IQ1) | 14.1% | 16.9% |
| Interquartile 75% (IQ3) | 18.1% | 20.0% |
| Interquartile Range (IQR) | 4.0% | 3.1% |
| Standard Deviation (Sample) | 7.3% | 4.9% |
| Standard Deviation (Population) | 7.2% | 4.9% |
Similar Demographics by Cognitive Disability
Demographics Similar to Irish by Cognitive Disability
In terms of cognitive disability, the demographic groups most similar to Irish are Immigrants from Russia (16.8%, a difference of 0.030%), Immigrants from Asia (16.8%, a difference of 0.030%), Paraguayan (16.8%, a difference of 0.050%), Palestinian (16.8%, a difference of 0.050%), and Jordanian (16.8%, a difference of 0.060%).
| Demographics | Rating | Rank | Cognitive Disability |
| English | 98.6 /100 | #95 | Exceptional 16.8% |
| Finns | 98.5 /100 | #96 | Exceptional 16.8% |
| Dutch | 98.5 /100 | #97 | Exceptional 16.8% |
| Immigrants | Lebanon | 98.4 /100 | #98 | Exceptional 16.8% |
| Jordanians | 98.2 /100 | #99 | Exceptional 16.8% |
| Immigrants | Russia | 98.2 /100 | #100 | Exceptional 16.8% |
| Immigrants | Asia | 98.1 /100 | #101 | Exceptional 16.8% |
| Irish | 98.1 /100 | #102 | Exceptional 16.8% |
| Paraguayans | 98.0 /100 | #103 | Exceptional 16.8% |
| Palestinians | 98.0 /100 | #104 | Exceptional 16.8% |
| Immigrants | Eastern Asia | 97.9 /100 | #105 | Exceptional 16.8% |
| Northern Europeans | 97.8 /100 | #106 | Exceptional 16.8% |
| Immigrants | Nicaragua | 97.8 /100 | #107 | Exceptional 16.8% |
| Canadians | 97.5 /100 | #108 | Exceptional 16.8% |
| Albanians | 97.3 /100 | #109 | Exceptional 16.8% |
Demographics Similar to Chickasaw by Cognitive Disability
In terms of cognitive disability, the demographic groups most similar to Chickasaw are Yaqui (18.5%, a difference of 0.11%), Subsaharan African (18.5%, a difference of 0.17%), Hmong (18.4%, a difference of 0.29%), Choctaw (18.4%, a difference of 0.31%), and Immigrants from Dominica (18.6%, a difference of 0.35%).
| Demographics | Rating | Rank | Cognitive Disability |
| Colville | 0.0 /100 | #305 | Tragic 18.3% |
| Seminole | 0.0 /100 | #306 | Tragic 18.3% |
| Ugandans | 0.0 /100 | #307 | Tragic 18.3% |
| Immigrants | Western Africa | 0.0 /100 | #308 | Tragic 18.4% |
| Immigrants | Eastern Africa | 0.0 /100 | #309 | Tragic 18.4% |
| Choctaw | 0.0 /100 | #310 | Tragic 18.4% |
| Hmong | 0.0 /100 | #311 | Tragic 18.4% |
| Chickasaw | 0.0 /100 | #312 | Tragic 18.5% |
| Yaqui | 0.0 /100 | #313 | Tragic 18.5% |
| Sub-Saharan Africans | 0.0 /100 | #314 | Tragic 18.5% |
| Immigrants | Dominica | 0.0 /100 | #315 | Tragic 18.6% |
| Immigrants | Middle Africa | 0.0 /100 | #316 | Tragic 18.6% |
| Liberians | 0.0 /100 | #317 | Tragic 18.6% |
| Bangladeshis | 0.0 /100 | #318 | Tragic 18.6% |
| Comanche | 0.0 /100 | #319 | Tragic 18.6% |