Irish vs Immigrants from Kuwait Doctorate Degree
COMPARE
Irish
Immigrants from Kuwait
Doctorate Degree
Doctorate Degree Comparison
Irish
Immigrants from Kuwait
1.9%
DOCTORATE DEGREE
67.5/ 100
METRIC RATING
162nd/ 347
METRIC RANK
2.6%
DOCTORATE DEGREE
100.0/ 100
METRIC RATING
37th/ 347
METRIC RANK
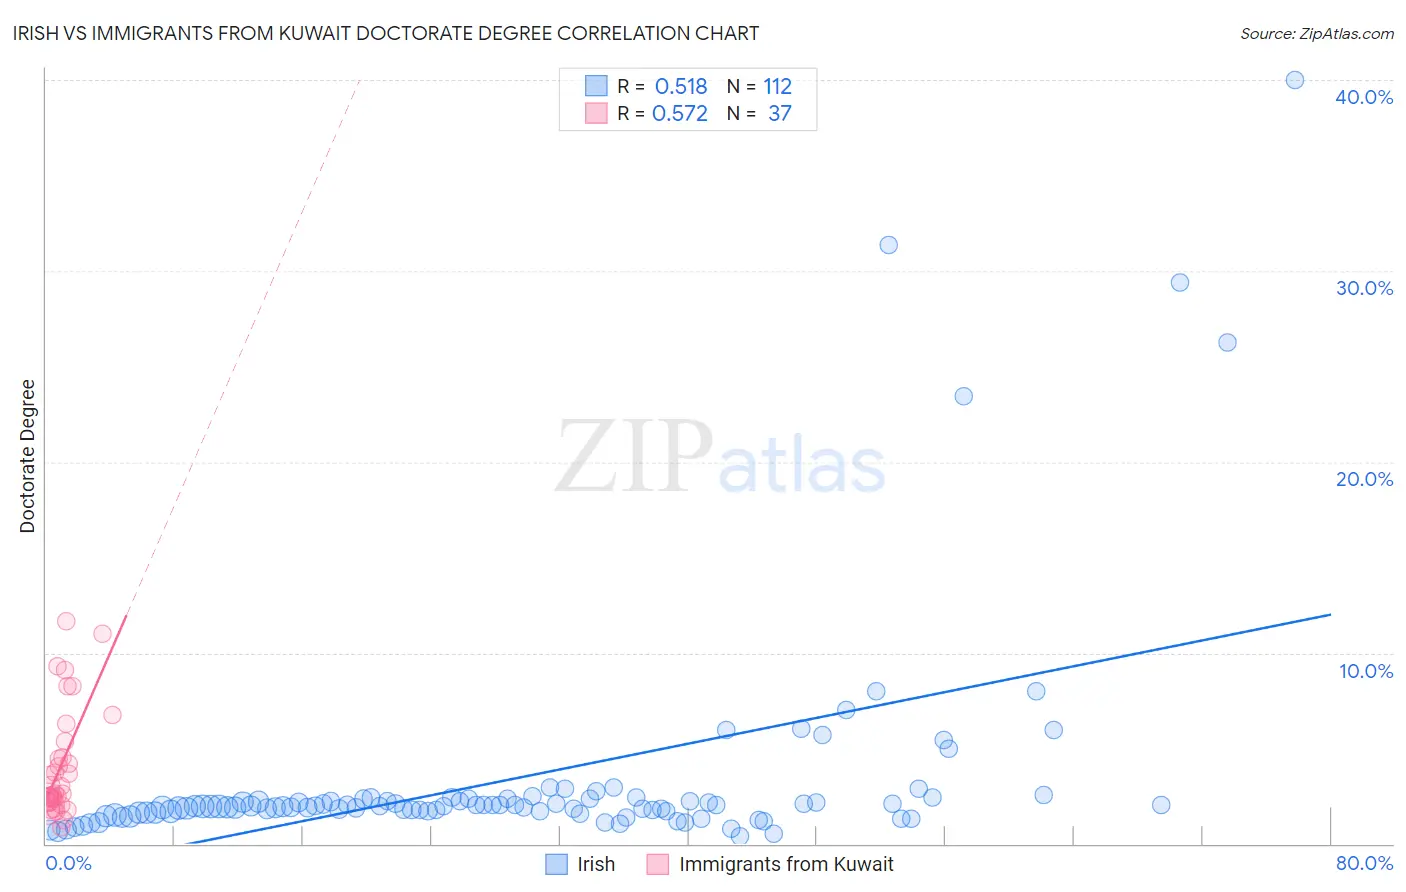
Irish vs Immigrants from Kuwait Doctorate Degree Correlation Chart
The statistical analysis conducted on geographies consisting of 550,861,641 people shows a substantial positive correlation between the proportion of Irish and percentage of population with at least doctorate degree education in the United States with a correlation coefficient (R) of 0.518 and weighted average of 1.9%. Similarly, the statistical analysis conducted on geographies consisting of 136,719,755 people shows a substantial positive correlation between the proportion of Immigrants from Kuwait and percentage of population with at least doctorate degree education in the United States with a correlation coefficient (R) of 0.572 and weighted average of 2.6%, a difference of 35.3%.
Doctorate Degree Correlation Summary
| Measurement | Irish | Immigrants from Kuwait |
| Minimum | 0.38% | 0.82% |
| Maximum | 40.0% | 11.6% |
| Range | 39.6% | 10.8% |
| Mean | 3.4% | 4.1% |
| Median | 2.0% | 2.6% |
| Interquartile 25% (IQ1) | 1.7% | 2.2% |
| Interquartile 75% (IQ3) | 2.3% | 4.9% |
| Interquartile Range (IQR) | 0.66% | 2.7% |
| Standard Deviation (Sample) | 6.1% | 2.8% |
| Standard Deviation (Population) | 6.0% | 2.8% |
Similar Demographics by Doctorate Degree
Demographics Similar to Irish by Doctorate Degree
In terms of doctorate degree, the demographic groups most similar to Irish are Czech (1.9%, a difference of 0.040%), Celtic (1.9%, a difference of 0.13%), Immigrants from Middle Africa (1.9%, a difference of 0.21%), Welsh (1.9%, a difference of 0.36%), and Slovene (1.9%, a difference of 0.45%).
| Demographics | Rating | Rank | Doctorate Degree |
| Poles | 72.7 /100 | #155 | Good 1.9% |
| Slavs | 72.4 /100 | #156 | Good 1.9% |
| Danes | 71.9 /100 | #157 | Good 1.9% |
| Hungarians | 71.7 /100 | #158 | Good 1.9% |
| Slovenes | 70.2 /100 | #159 | Good 1.9% |
| Welsh | 69.7 /100 | #160 | Good 1.9% |
| Immigrants | Middle Africa | 68.8 /100 | #161 | Good 1.9% |
| Irish | 67.5 /100 | #162 | Good 1.9% |
| Czechs | 67.3 /100 | #163 | Good 1.9% |
| Celtics | 66.7 /100 | #164 | Good 1.9% |
| Scotch-Irish | 63.6 /100 | #165 | Good 1.9% |
| Spaniards | 63.5 /100 | #166 | Good 1.9% |
| Macedonians | 60.9 /100 | #167 | Good 1.9% |
| Sri Lankans | 60.3 /100 | #168 | Good 1.9% |
| Vietnamese | 54.8 /100 | #169 | Average 1.9% |
Demographics Similar to Immigrants from Kuwait by Doctorate Degree
In terms of doctorate degree, the demographic groups most similar to Immigrants from Kuwait are Russian (2.6%, a difference of 0.15%), Immigrants from Spain (2.6%, a difference of 0.26%), Immigrants from Malaysia (2.6%, a difference of 0.32%), Cypriot (2.6%, a difference of 0.38%), and Cambodian (2.6%, a difference of 0.50%).
| Demographics | Rating | Rank | Doctorate Degree |
| Immigrants | Korea | 100.0 /100 | #30 | Exceptional 2.6% |
| Latvians | 100.0 /100 | #31 | Exceptional 2.6% |
| Immigrants | Northern Europe | 100.0 /100 | #32 | Exceptional 2.6% |
| Cambodians | 100.0 /100 | #33 | Exceptional 2.6% |
| Cypriots | 100.0 /100 | #34 | Exceptional 2.6% |
| Immigrants | Malaysia | 100.0 /100 | #35 | Exceptional 2.6% |
| Immigrants | Spain | 100.0 /100 | #36 | Exceptional 2.6% |
| Immigrants | Kuwait | 100.0 /100 | #37 | Exceptional 2.6% |
| Russians | 100.0 /100 | #38 | Exceptional 2.6% |
| Immigrants | Ireland | 100.0 /100 | #39 | Exceptional 2.5% |
| Estonians | 100.0 /100 | #40 | Exceptional 2.5% |
| Immigrants | Russia | 100.0 /100 | #41 | Exceptional 2.5% |
| New Zealanders | 100.0 /100 | #42 | Exceptional 2.5% |
| Soviet Union | 100.0 /100 | #43 | Exceptional 2.5% |
| Immigrants | Netherlands | 100.0 /100 | #44 | Exceptional 2.5% |