Irish vs Immigrants from China Per Capita Income
COMPARE
Irish
Immigrants from China
Per Capita Income
Per Capita Income Comparison
Irish
Immigrants from China
$44,679
PER CAPITA INCOME
75.8/ 100
METRIC RATING
146th/ 347
METRIC RANK
$54,264
PER CAPITA INCOME
100.0/ 100
METRIC RATING
19th/ 347
METRIC RANK
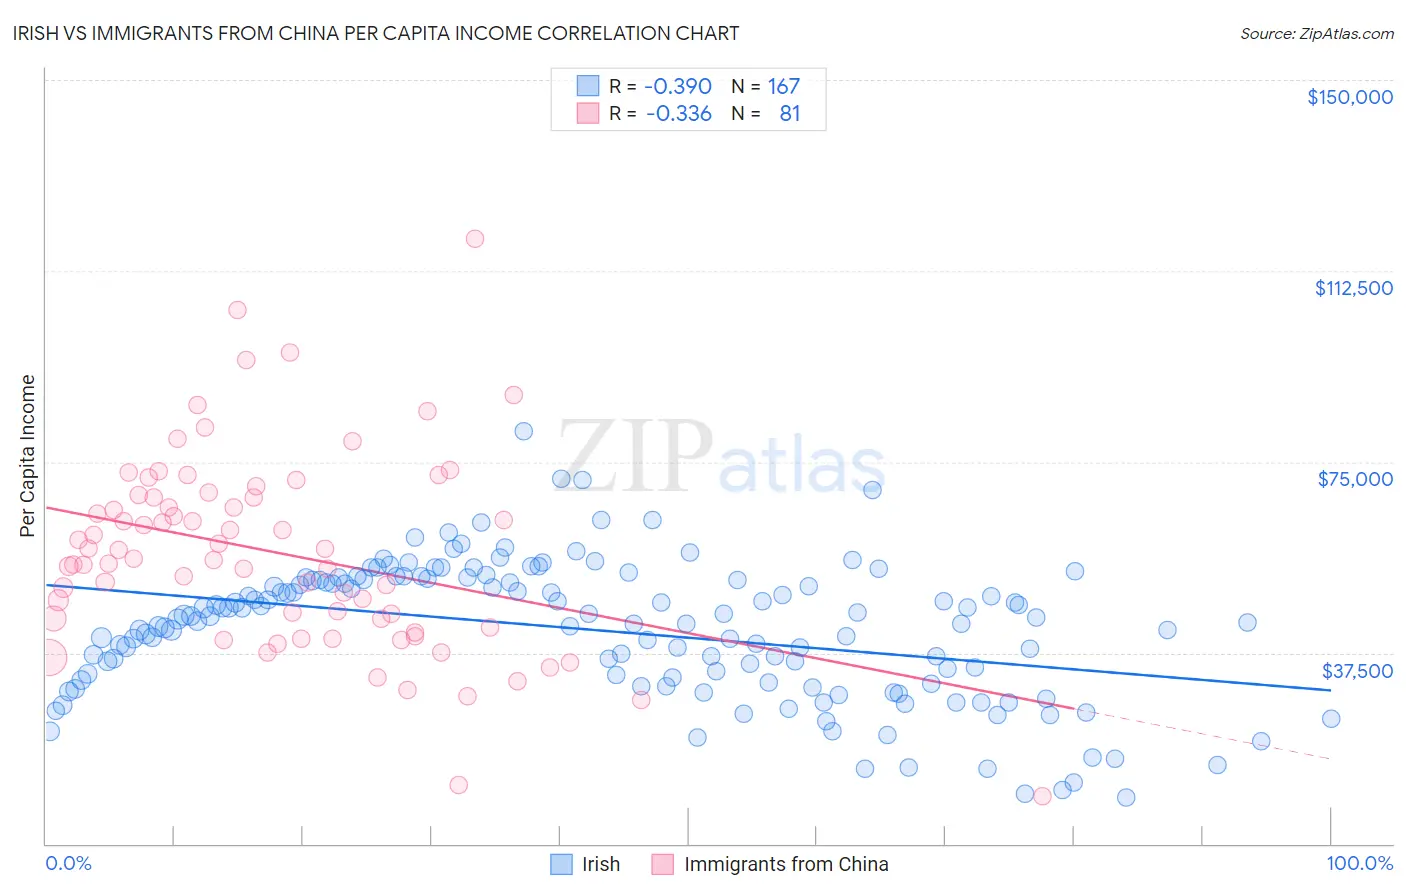
Irish vs Immigrants from China Per Capita Income Correlation Chart
The statistical analysis conducted on geographies consisting of 580,769,300 people shows a mild negative correlation between the proportion of Irish and per capita income in the United States with a correlation coefficient (R) of -0.390 and weighted average of $44,679. Similarly, the statistical analysis conducted on geographies consisting of 457,115,430 people shows a mild negative correlation between the proportion of Immigrants from China and per capita income in the United States with a correlation coefficient (R) of -0.336 and weighted average of $54,264, a difference of 21.4%.
Per Capita Income Correlation Summary
| Measurement | Irish | Immigrants from China |
| Minimum | $9,015 | $9,290 |
| Maximum | $80,942 | $118,834 |
| Range | $71,927 | $109,544 |
| Mean | $42,054 | $57,158 |
| Median | $44,449 | $56,059 |
| Interquartile 25% (IQ1) | $32,164 | $43,379 |
| Interquartile 75% (IQ3) | $51,890 | $68,324 |
| Interquartile Range (IQR) | $19,726 | $24,945 |
| Standard Deviation (Sample) | $13,324 | $19,265 |
| Standard Deviation (Population) | $13,284 | $19,145 |
Similar Demographics by Per Capita Income
Demographics Similar to Irish by Per Capita Income
In terms of per capita income, the demographic groups most similar to Irish are Czech ($44,595, a difference of 0.19%), Immigrants from Afghanistan ($44,790, a difference of 0.25%), Immigrants from Armenia ($44,552, a difference of 0.28%), Korean ($44,522, a difference of 0.35%), and Immigrants from Eritrea ($44,509, a difference of 0.38%).
| Demographics | Rating | Rank | Per Capita Income |
| Basques | 83.2 /100 | #139 | Excellent $45,086 |
| Immigrants | Jordan | 82.9 /100 | #140 | Excellent $45,066 |
| Slavs | 82.6 /100 | #141 | Excellent $45,049 |
| Ugandans | 82.6 /100 | #142 | Excellent $45,047 |
| Immigrants | Uganda | 82.5 /100 | #143 | Excellent $45,043 |
| Icelanders | 81.6 /100 | #144 | Excellent $44,987 |
| Immigrants | Afghanistan | 78.0 /100 | #145 | Good $44,790 |
| Irish | 75.8 /100 | #146 | Good $44,679 |
| Czechs | 74.1 /100 | #147 | Good $44,595 |
| Immigrants | Armenia | 73.1 /100 | #148 | Good $44,552 |
| Koreans | 72.5 /100 | #149 | Good $44,522 |
| Immigrants | Eritrea | 72.1 /100 | #150 | Good $44,509 |
| Norwegians | 71.5 /100 | #151 | Good $44,480 |
| Peruvians | 71.5 /100 | #152 | Good $44,479 |
| Scottish | 70.6 /100 | #153 | Good $44,440 |
Demographics Similar to Immigrants from China by Per Capita Income
In terms of per capita income, the demographic groups most similar to Immigrants from China are Thai ($54,307, a difference of 0.080%), Soviet Union ($54,202, a difference of 0.11%), Immigrants from Northern Europe ($54,159, a difference of 0.19%), Immigrants from France ($54,557, a difference of 0.54%), and Indian (Asian) ($53,874, a difference of 0.72%).
| Demographics | Rating | Rank | Per Capita Income |
| Immigrants | Sweden | 100.0 /100 | #12 | Exceptional $55,582 |
| Immigrants | India | 100.0 /100 | #13 | Exceptional $55,268 |
| Immigrants | Belgium | 100.0 /100 | #14 | Exceptional $55,082 |
| Cypriots | 100.0 /100 | #15 | Exceptional $54,899 |
| Immigrants | Switzerland | 100.0 /100 | #16 | Exceptional $54,866 |
| Immigrants | France | 100.0 /100 | #17 | Exceptional $54,557 |
| Thais | 100.0 /100 | #18 | Exceptional $54,307 |
| Immigrants | China | 100.0 /100 | #19 | Exceptional $54,264 |
| Soviet Union | 100.0 /100 | #20 | Exceptional $54,202 |
| Immigrants | Northern Europe | 100.0 /100 | #21 | Exceptional $54,159 |
| Indians (Asian) | 100.0 /100 | #22 | Exceptional $53,874 |
| Immigrants | Eastern Asia | 100.0 /100 | #23 | Exceptional $53,806 |
| Immigrants | Denmark | 100.0 /100 | #24 | Exceptional $53,799 |
| Immigrants | Japan | 100.0 /100 | #25 | Exceptional $53,359 |
| Russians | 100.0 /100 | #26 | Exceptional $53,154 |