Iranian vs Samoan Cognitive Disability
COMPARE
Iranian
Samoan
Cognitive Disability
Cognitive Disability Comparison
Iranians
Samoans
16.5%
COGNITIVE DISABILITY
99.8/ 100
METRIC RATING
49th/ 347
METRIC RANK
17.9%
COGNITIVE DISABILITY
0.7/ 100
METRIC RATING
247th/ 347
METRIC RANK
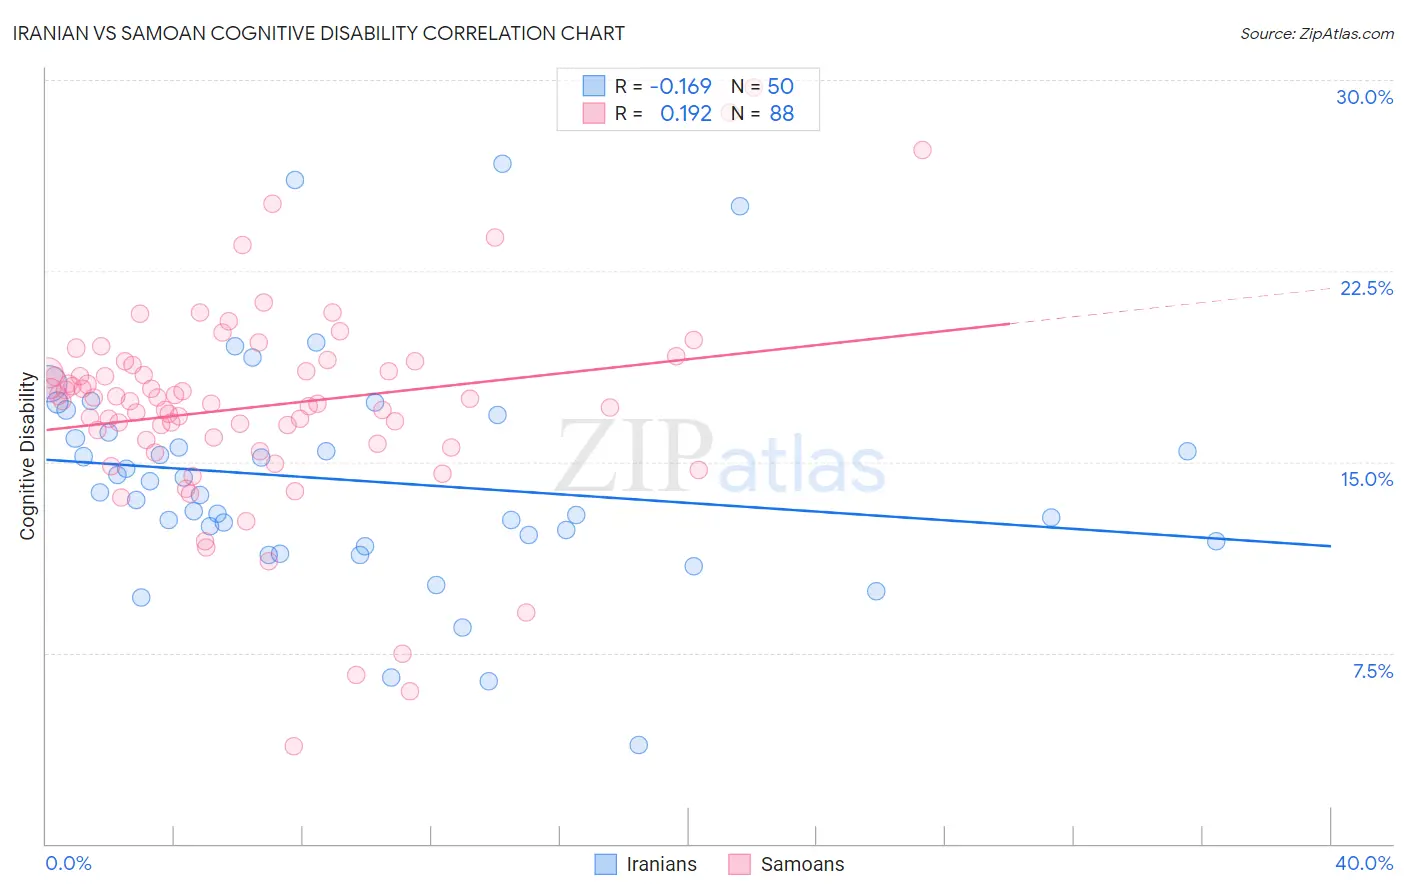
Iranian vs Samoan Cognitive Disability Correlation Chart
The statistical analysis conducted on geographies consisting of 316,831,164 people shows a poor negative correlation between the proportion of Iranians and percentage of population with cognitive disability in the United States with a correlation coefficient (R) of -0.169 and weighted average of 16.5%. Similarly, the statistical analysis conducted on geographies consisting of 225,130,180 people shows a poor positive correlation between the proportion of Samoans and percentage of population with cognitive disability in the United States with a correlation coefficient (R) of 0.192 and weighted average of 17.9%, a difference of 8.4%.
Cognitive Disability Correlation Summary
| Measurement | Iranian | Samoan |
| Minimum | 3.9% | 3.8% |
| Maximum | 26.7% | 29.7% |
| Range | 22.8% | 25.9% |
| Mean | 14.3% | 17.2% |
| Median | 13.7% | 17.4% |
| Interquartile 25% (IQ1) | 11.9% | 15.8% |
| Interquartile 75% (IQ3) | 16.2% | 18.7% |
| Interquartile Range (IQR) | 4.3% | 2.9% |
| Standard Deviation (Sample) | 4.4% | 4.1% |
| Standard Deviation (Population) | 4.4% | 4.1% |
Similar Demographics by Cognitive Disability
Demographics Similar to Iranians by Cognitive Disability
In terms of cognitive disability, the demographic groups most similar to Iranians are Norwegian (16.5%, a difference of 0.010%), Immigrants from Italy (16.5%, a difference of 0.040%), Immigrants from North America (16.5%, a difference of 0.040%), Immigrants from Korea (16.5%, a difference of 0.050%), and Immigrants from Colombia (16.5%, a difference of 0.070%).
| Demographics | Rating | Rank | Cognitive Disability |
| Hungarians | 99.9 /100 | #42 | Exceptional 16.5% |
| Immigrants | Canada | 99.8 /100 | #43 | Exceptional 16.5% |
| Macedonians | 99.8 /100 | #44 | Exceptional 16.5% |
| Immigrants | Europe | 99.8 /100 | #45 | Exceptional 16.5% |
| Immigrants | Colombia | 99.8 /100 | #46 | Exceptional 16.5% |
| Immigrants | Italy | 99.8 /100 | #47 | Exceptional 16.5% |
| Immigrants | North America | 99.8 /100 | #48 | Exceptional 16.5% |
| Iranians | 99.8 /100 | #49 | Exceptional 16.5% |
| Norwegians | 99.8 /100 | #50 | Exceptional 16.5% |
| Immigrants | Korea | 99.8 /100 | #51 | Exceptional 16.5% |
| Soviet Union | 99.8 /100 | #52 | Exceptional 16.5% |
| Swedes | 99.8 /100 | #53 | Exceptional 16.5% |
| Immigrants | Iran | 99.8 /100 | #54 | Exceptional 16.5% |
| Immigrants | Venezuela | 99.7 /100 | #55 | Exceptional 16.5% |
| Austrians | 99.7 /100 | #56 | Exceptional 16.6% |
Demographics Similar to Samoans by Cognitive Disability
In terms of cognitive disability, the demographic groups most similar to Samoans are French American Indian (17.9%, a difference of 0.010%), Cree (17.9%, a difference of 0.060%), Immigrants from Ethiopia (17.9%, a difference of 0.060%), Immigrants from Thailand (17.9%, a difference of 0.070%), and Malaysian (17.9%, a difference of 0.070%).
| Demographics | Rating | Rank | Cognitive Disability |
| Iraqis | 1.4 /100 | #240 | Tragic 17.8% |
| Mexicans | 1.1 /100 | #241 | Tragic 17.8% |
| Paiute | 1.1 /100 | #242 | Tragic 17.8% |
| Immigrants | Bangladesh | 1.0 /100 | #243 | Tragic 17.8% |
| Jamaicans | 0.9 /100 | #244 | Tragic 17.9% |
| Trinidadians and Tobagonians | 0.8 /100 | #245 | Tragic 17.9% |
| Immigrants | Thailand | 0.8 /100 | #246 | Tragic 17.9% |
| Samoans | 0.7 /100 | #247 | Tragic 17.9% |
| French American Indians | 0.7 /100 | #248 | Tragic 17.9% |
| Cree | 0.7 /100 | #249 | Tragic 17.9% |
| Immigrants | Ethiopia | 0.7 /100 | #250 | Tragic 17.9% |
| Malaysians | 0.6 /100 | #251 | Tragic 17.9% |
| Immigrants | Grenada | 0.6 /100 | #252 | Tragic 17.9% |
| Hopi | 0.6 /100 | #253 | Tragic 17.9% |
| Hispanics or Latinos | 0.6 /100 | #254 | Tragic 17.9% |