Armenian vs Samoan Cognitive Disability
COMPARE
Armenian
Samoan
Cognitive Disability
Cognitive Disability Comparison
Armenians
Samoans
17.2%
COGNITIVE DISABILITY
70.1/ 100
METRIC RATING
164th/ 347
METRIC RANK
17.9%
COGNITIVE DISABILITY
0.7/ 100
METRIC RATING
247th/ 347
METRIC RANK
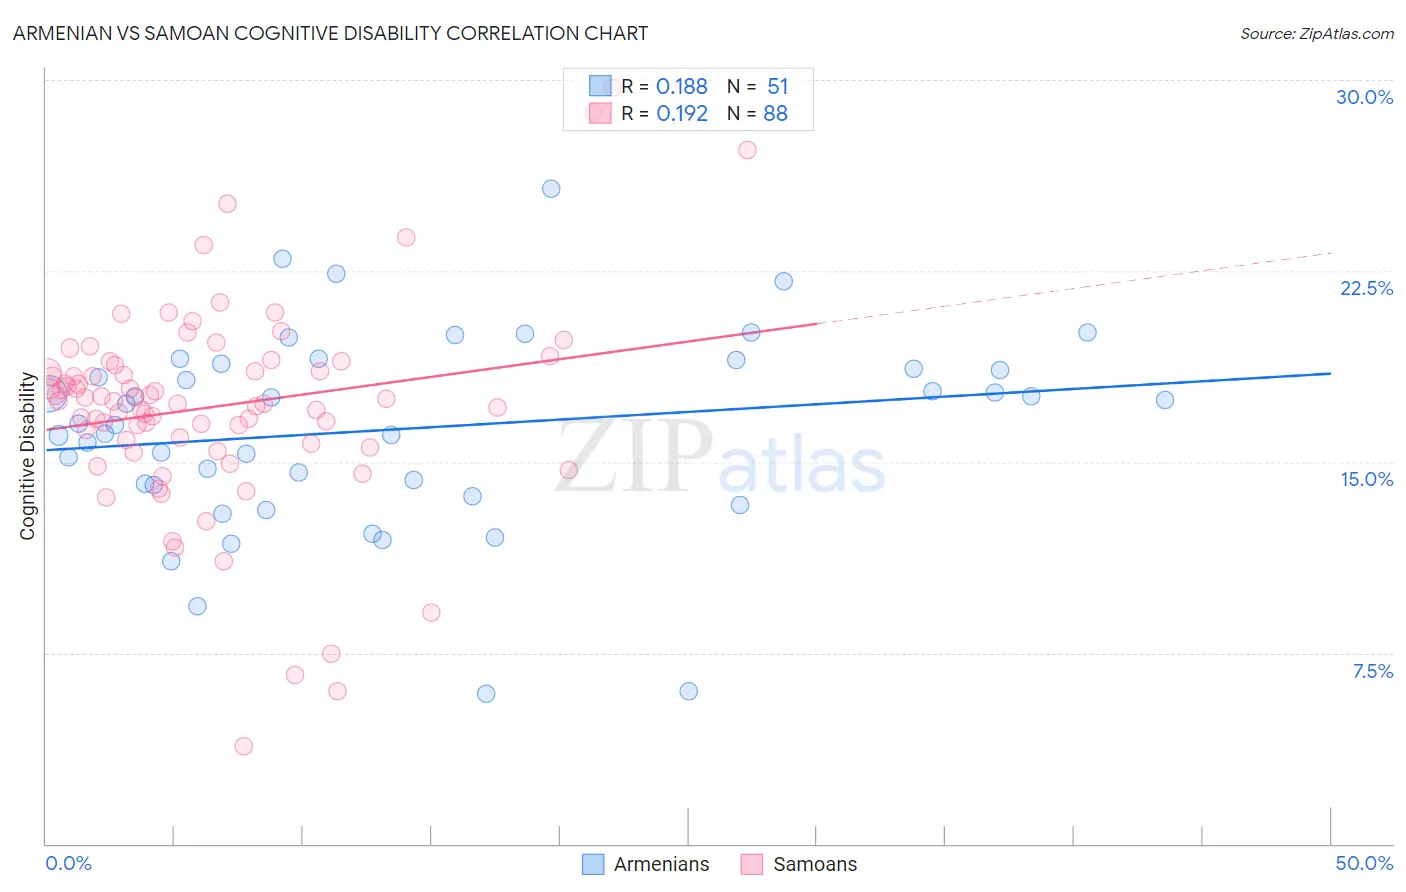
Armenian vs Samoan Cognitive Disability Correlation Chart
The statistical analysis conducted on geographies consisting of 310,934,651 people shows a poor positive correlation between the proportion of Armenians and percentage of population with cognitive disability in the United States with a correlation coefficient (R) of 0.188 and weighted average of 17.2%. Similarly, the statistical analysis conducted on geographies consisting of 225,130,180 people shows a poor positive correlation between the proportion of Samoans and percentage of population with cognitive disability in the United States with a correlation coefficient (R) of 0.192 and weighted average of 17.9%, a difference of 4.2%.
Cognitive Disability Correlation Summary
| Measurement | Armenian | Samoan |
| Minimum | 5.9% | 3.8% |
| Maximum | 25.7% | 29.7% |
| Range | 19.9% | 25.9% |
| Mean | 16.3% | 17.2% |
| Median | 16.5% | 17.4% |
| Interquartile 25% (IQ1) | 14.1% | 15.8% |
| Interquartile 75% (IQ3) | 18.8% | 18.7% |
| Interquartile Range (IQR) | 4.8% | 2.9% |
| Standard Deviation (Sample) | 3.9% | 4.1% |
| Standard Deviation (Population) | 3.9% | 4.1% |
Similar Demographics by Cognitive Disability
Demographics Similar to Armenians by Cognitive Disability
In terms of cognitive disability, the demographic groups most similar to Armenians are Yugoslavian (17.2%, a difference of 0.050%), Immigrants from Switzerland (17.2%, a difference of 0.050%), American (17.2%, a difference of 0.070%), Australian (17.2%, a difference of 0.080%), and Immigrants from Latvia (17.2%, a difference of 0.11%).
| Demographics | Rating | Rank | Cognitive Disability |
| Immigrants | Australia | 76.0 /100 | #157 | Good 17.1% |
| Celtics | 74.1 /100 | #158 | Good 17.1% |
| Immigrants | Latvia | 73.2 /100 | #159 | Good 17.2% |
| Australians | 72.4 /100 | #160 | Good 17.2% |
| Americans | 72.2 /100 | #161 | Good 17.2% |
| Yugoslavians | 71.6 /100 | #162 | Good 17.2% |
| Immigrants | Switzerland | 71.5 /100 | #163 | Good 17.2% |
| Armenians | 70.1 /100 | #164 | Good 17.2% |
| Immigrants | Albania | 64.9 /100 | #165 | Good 17.2% |
| Immigrants | Ecuador | 64.4 /100 | #166 | Good 17.2% |
| Immigrants | Syria | 63.5 /100 | #167 | Good 17.2% |
| Immigrants | Immigrants | 62.5 /100 | #168 | Good 17.2% |
| Immigrants | Portugal | 61.8 /100 | #169 | Good 17.2% |
| Ecuadorians | 59.6 /100 | #170 | Average 17.2% |
| Tlingit-Haida | 59.4 /100 | #171 | Average 17.2% |
Demographics Similar to Samoans by Cognitive Disability
In terms of cognitive disability, the demographic groups most similar to Samoans are French American Indian (17.9%, a difference of 0.010%), Cree (17.9%, a difference of 0.060%), Immigrants from Ethiopia (17.9%, a difference of 0.060%), Immigrants from Thailand (17.9%, a difference of 0.070%), and Malaysian (17.9%, a difference of 0.070%).
| Demographics | Rating | Rank | Cognitive Disability |
| Iraqis | 1.4 /100 | #240 | Tragic 17.8% |
| Mexicans | 1.1 /100 | #241 | Tragic 17.8% |
| Paiute | 1.1 /100 | #242 | Tragic 17.8% |
| Immigrants | Bangladesh | 1.0 /100 | #243 | Tragic 17.8% |
| Jamaicans | 0.9 /100 | #244 | Tragic 17.9% |
| Trinidadians and Tobagonians | 0.8 /100 | #245 | Tragic 17.9% |
| Immigrants | Thailand | 0.8 /100 | #246 | Tragic 17.9% |
| Samoans | 0.7 /100 | #247 | Tragic 17.9% |
| French American Indians | 0.7 /100 | #248 | Tragic 17.9% |
| Cree | 0.7 /100 | #249 | Tragic 17.9% |
| Immigrants | Ethiopia | 0.7 /100 | #250 | Tragic 17.9% |
| Malaysians | 0.6 /100 | #251 | Tragic 17.9% |
| Immigrants | Grenada | 0.6 /100 | #252 | Tragic 17.9% |
| Hopi | 0.6 /100 | #253 | Tragic 17.9% |
| Hispanics or Latinos | 0.6 /100 | #254 | Tragic 17.9% |