Iranian vs Yup'ik Cognitive Disability
COMPARE
Iranian
Yup'ik
Cognitive Disability
Cognitive Disability Comparison
Iranians
Yup'ik
16.5%
COGNITIVE DISABILITY
99.8/ 100
METRIC RATING
49th/ 347
METRIC RANK
16.9%
COGNITIVE DISABILITY
96.9/ 100
METRIC RATING
115th/ 347
METRIC RANK
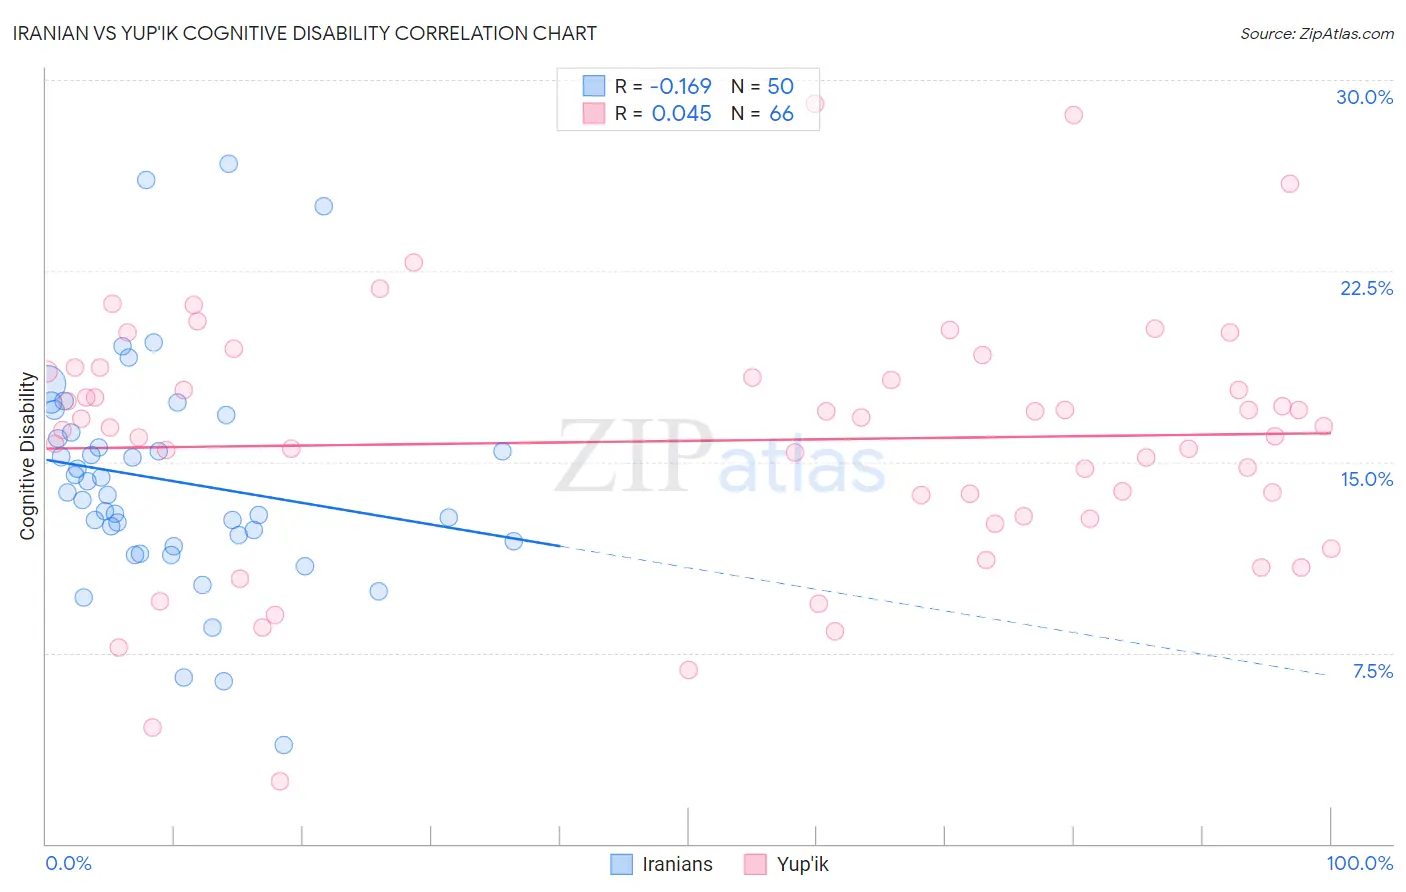
Iranian vs Yup'ik Cognitive Disability Correlation Chart
The statistical analysis conducted on geographies consisting of 316,831,164 people shows a poor negative correlation between the proportion of Iranians and percentage of population with cognitive disability in the United States with a correlation coefficient (R) of -0.169 and weighted average of 16.5%. Similarly, the statistical analysis conducted on geographies consisting of 39,961,414 people shows no correlation between the proportion of Yup'ik and percentage of population with cognitive disability in the United States with a correlation coefficient (R) of 0.045 and weighted average of 16.9%, a difference of 2.1%.
Cognitive Disability Correlation Summary
| Measurement | Iranian | Yup'ik |
| Minimum | 3.9% | 2.5% |
| Maximum | 26.7% | 29.1% |
| Range | 22.8% | 26.6% |
| Mean | 14.3% | 15.8% |
| Median | 13.7% | 16.4% |
| Interquartile 25% (IQ1) | 11.9% | 12.9% |
| Interquartile 75% (IQ3) | 16.2% | 18.5% |
| Interquartile Range (IQR) | 4.3% | 5.7% |
| Standard Deviation (Sample) | 4.4% | 5.0% |
| Standard Deviation (Population) | 4.4% | 5.0% |
Similar Demographics by Cognitive Disability
Demographics Similar to Iranians by Cognitive Disability
In terms of cognitive disability, the demographic groups most similar to Iranians are Norwegian (16.5%, a difference of 0.010%), Immigrants from Italy (16.5%, a difference of 0.040%), Immigrants from North America (16.5%, a difference of 0.040%), Immigrants from Korea (16.5%, a difference of 0.050%), and Immigrants from Colombia (16.5%, a difference of 0.070%).
| Demographics | Rating | Rank | Cognitive Disability |
| Hungarians | 99.9 /100 | #42 | Exceptional 16.5% |
| Immigrants | Canada | 99.8 /100 | #43 | Exceptional 16.5% |
| Macedonians | 99.8 /100 | #44 | Exceptional 16.5% |
| Immigrants | Europe | 99.8 /100 | #45 | Exceptional 16.5% |
| Immigrants | Colombia | 99.8 /100 | #46 | Exceptional 16.5% |
| Immigrants | Italy | 99.8 /100 | #47 | Exceptional 16.5% |
| Immigrants | North America | 99.8 /100 | #48 | Exceptional 16.5% |
| Iranians | 99.8 /100 | #49 | Exceptional 16.5% |
| Norwegians | 99.8 /100 | #50 | Exceptional 16.5% |
| Immigrants | Korea | 99.8 /100 | #51 | Exceptional 16.5% |
| Soviet Union | 99.8 /100 | #52 | Exceptional 16.5% |
| Swedes | 99.8 /100 | #53 | Exceptional 16.5% |
| Immigrants | Iran | 99.8 /100 | #54 | Exceptional 16.5% |
| Immigrants | Venezuela | 99.7 /100 | #55 | Exceptional 16.5% |
| Austrians | 99.7 /100 | #56 | Exceptional 16.6% |
Demographics Similar to Yup'ik by Cognitive Disability
In terms of cognitive disability, the demographic groups most similar to Yup'ik are Korean (16.8%, a difference of 0.050%), Indian (Asian) (16.8%, a difference of 0.060%), Immigrants from Sri Lanka (16.8%, a difference of 0.060%), Uruguayan (16.8%, a difference of 0.080%), and Arapaho (16.8%, a difference of 0.090%).
| Demographics | Rating | Rank | Cognitive Disability |
| Canadians | 97.5 /100 | #108 | Exceptional 16.8% |
| Albanians | 97.3 /100 | #109 | Exceptional 16.8% |
| Arapaho | 97.3 /100 | #110 | Exceptional 16.8% |
| Uruguayans | 97.2 /100 | #111 | Exceptional 16.8% |
| Indians (Asian) | 97.2 /100 | #112 | Exceptional 16.8% |
| Immigrants | Sri Lanka | 97.1 /100 | #113 | Exceptional 16.8% |
| Koreans | 97.1 /100 | #114 | Exceptional 16.8% |
| Yup'ik | 96.9 /100 | #115 | Exceptional 16.9% |
| Inupiat | 96.5 /100 | #116 | Exceptional 16.9% |
| Immigrants | Japan | 96.2 /100 | #117 | Exceptional 16.9% |
| Immigrants | Denmark | 96.2 /100 | #118 | Exceptional 16.9% |
| South Africans | 95.5 /100 | #119 | Exceptional 16.9% |
| Scottish | 95.0 /100 | #120 | Exceptional 16.9% |
| Immigrants | China | 94.9 /100 | #121 | Exceptional 16.9% |
| Immigrants | Western Europe | 94.8 /100 | #122 | Exceptional 16.9% |