Iranian vs Samoan 1 or more Vehicles in Household
COMPARE
Iranian
Samoan
1 or more Vehicles in Household
1 or more Vehicles in Household Comparison
Iranians
Samoans
91.5%
1 OR MORE VEHICLES IN HOUSEHOLD
99.4/ 100
METRIC RATING
78th/ 347
METRIC RANK
92.4%
1 OR MORE VEHICLES IN HOUSEHOLD
100.0/ 100
METRIC RATING
31st/ 347
METRIC RANK
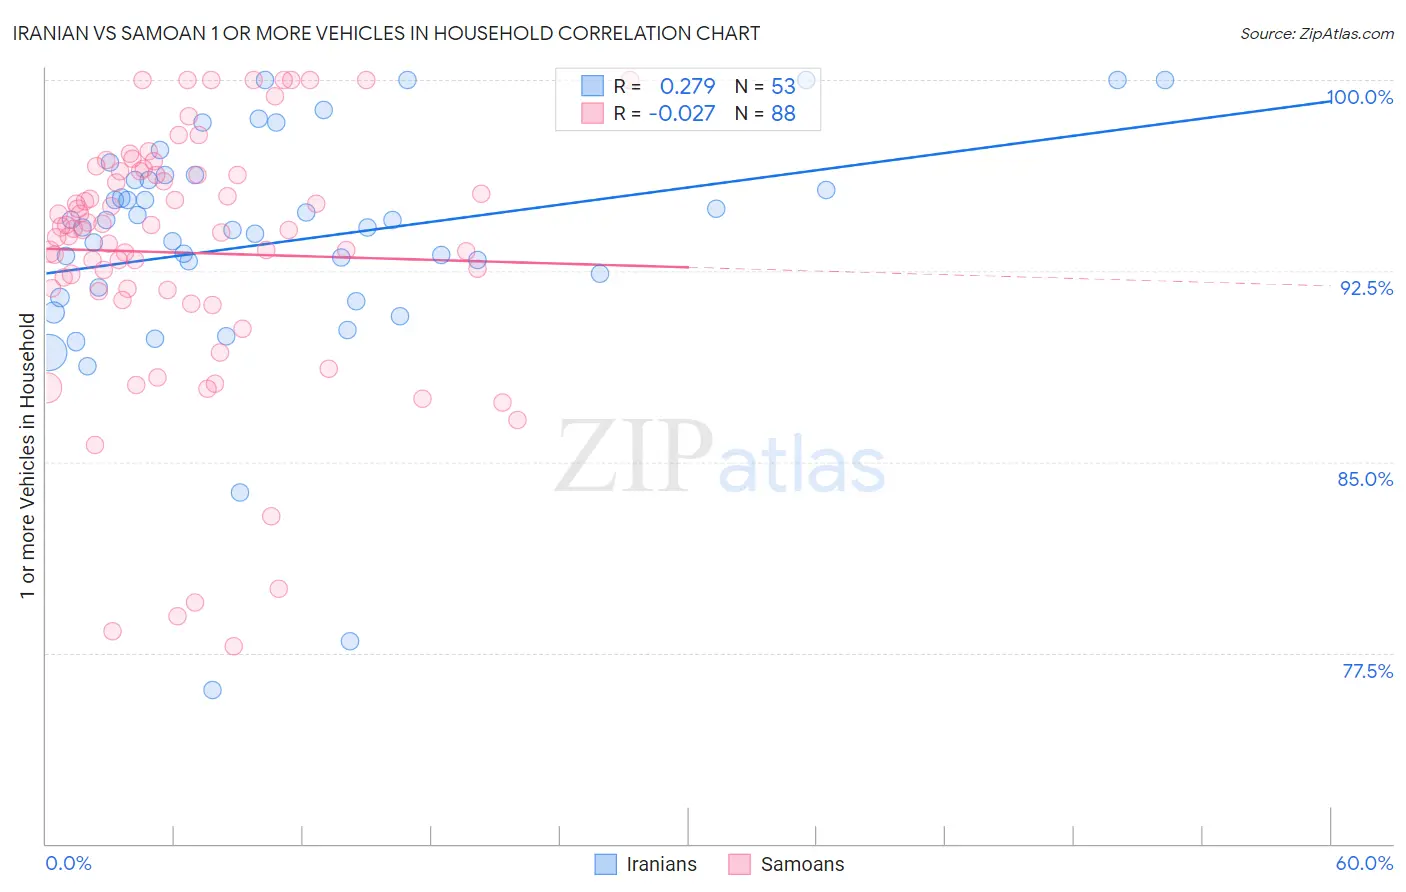
Iranian vs Samoan 1 or more Vehicles in Household Correlation Chart
The statistical analysis conducted on geographies consisting of 316,682,996 people shows a weak positive correlation between the proportion of Iranians and percentage of households with 1 or more vehicles available in the United States with a correlation coefficient (R) of 0.279 and weighted average of 91.5%. Similarly, the statistical analysis conducted on geographies consisting of 225,090,102 people shows no correlation between the proportion of Samoans and percentage of households with 1 or more vehicles available in the United States with a correlation coefficient (R) of -0.027 and weighted average of 92.4%, a difference of 1.0%.
1 or more Vehicles in Household Correlation Summary
| Measurement | Iranian | Samoan |
| Minimum | 76.0% | 77.7% |
| Maximum | 100.0% | 100.0% |
| Range | 24.0% | 22.3% |
| Mean | 93.6% | 93.2% |
| Median | 94.2% | 94.1% |
| Interquartile 25% (IQ1) | 91.6% | 91.7% |
| Interquartile 75% (IQ3) | 96.2% | 96.3% |
| Interquartile Range (IQR) | 4.5% | 4.6% |
| Standard Deviation (Sample) | 4.7% | 5.1% |
| Standard Deviation (Population) | 4.7% | 5.0% |
Similar Demographics by 1 or more Vehicles in Household
Demographics Similar to Iranians by 1 or more Vehicles in Household
In terms of 1 or more vehicles in household, the demographic groups most similar to Iranians are Immigrants from Philippines (91.5%, a difference of 0.0%), Immigrants from South Central Asia (91.5%, a difference of 0.020%), Bolivian (91.5%, a difference of 0.020%), Cuban (91.5%, a difference of 0.040%), and Immigrants from South Eastern Asia (91.4%, a difference of 0.050%).
| Demographics | Rating | Rank | 1 or more Vehicles in Household |
| Poles | 99.7 /100 | #71 | Exceptional 91.7% |
| Cajuns | 99.7 /100 | #72 | Exceptional 91.7% |
| Immigrants | Iran | 99.7 /100 | #73 | Exceptional 91.7% |
| Immigrants | Lebanon | 99.6 /100 | #74 | Exceptional 91.6% |
| Portuguese | 99.5 /100 | #75 | Exceptional 91.6% |
| Cubans | 99.5 /100 | #76 | Exceptional 91.5% |
| Immigrants | Philippines | 99.4 /100 | #77 | Exceptional 91.5% |
| Iranians | 99.4 /100 | #78 | Exceptional 91.5% |
| Immigrants | South Central Asia | 99.4 /100 | #79 | Exceptional 91.5% |
| Bolivians | 99.4 /100 | #80 | Exceptional 91.5% |
| Immigrants | South Eastern Asia | 99.3 /100 | #81 | Exceptional 91.4% |
| Lebanese | 99.3 /100 | #82 | Exceptional 91.4% |
| Immigrants | England | 99.3 /100 | #83 | Exceptional 91.4% |
| Jordanians | 99.3 /100 | #84 | Exceptional 91.4% |
| Tsimshian | 99.3 /100 | #85 | Exceptional 91.4% |
Demographics Similar to Samoans by 1 or more Vehicles in Household
In terms of 1 or more vehicles in household, the demographic groups most similar to Samoans are Native Hawaiian (92.4%, a difference of 0.010%), Finnish (92.4%, a difference of 0.010%), Sri Lankan (92.5%, a difference of 0.030%), Basque (92.4%, a difference of 0.040%), and Cherokee (92.4%, a difference of 0.050%).
| Demographics | Rating | Rank | 1 or more Vehicles in Household |
| Yaqui | 100.0 /100 | #24 | Exceptional 92.6% |
| Immigrants | Iraq | 100.0 /100 | #25 | Exceptional 92.5% |
| British | 100.0 /100 | #26 | Exceptional 92.5% |
| Americans | 100.0 /100 | #27 | Exceptional 92.5% |
| Sri Lankans | 100.0 /100 | #28 | Exceptional 92.5% |
| Native Hawaiians | 100.0 /100 | #29 | Exceptional 92.4% |
| Finns | 100.0 /100 | #30 | Exceptional 92.4% |
| Samoans | 100.0 /100 | #31 | Exceptional 92.4% |
| Basques | 100.0 /100 | #32 | Exceptional 92.4% |
| Cherokee | 100.0 /100 | #33 | Exceptional 92.4% |
| Italians | 99.9 /100 | #34 | Exceptional 92.3% |
| Czechoslovakians | 99.9 /100 | #35 | Exceptional 92.3% |
| Malaysians | 99.9 /100 | #36 | Exceptional 92.3% |
| French Canadians | 99.9 /100 | #37 | Exceptional 92.3% |
| Immigrants | Vietnam | 99.9 /100 | #38 | Exceptional 92.3% |