Bulgarian vs Samoan Cognitive Disability
COMPARE
Bulgarian
Samoan
Cognitive Disability
Cognitive Disability Comparison
Bulgarians
Samoans
16.3%
COGNITIVE DISABILITY
100.0/ 100
METRIC RATING
20th/ 347
METRIC RANK
17.9%
COGNITIVE DISABILITY
0.7/ 100
METRIC RATING
247th/ 347
METRIC RANK
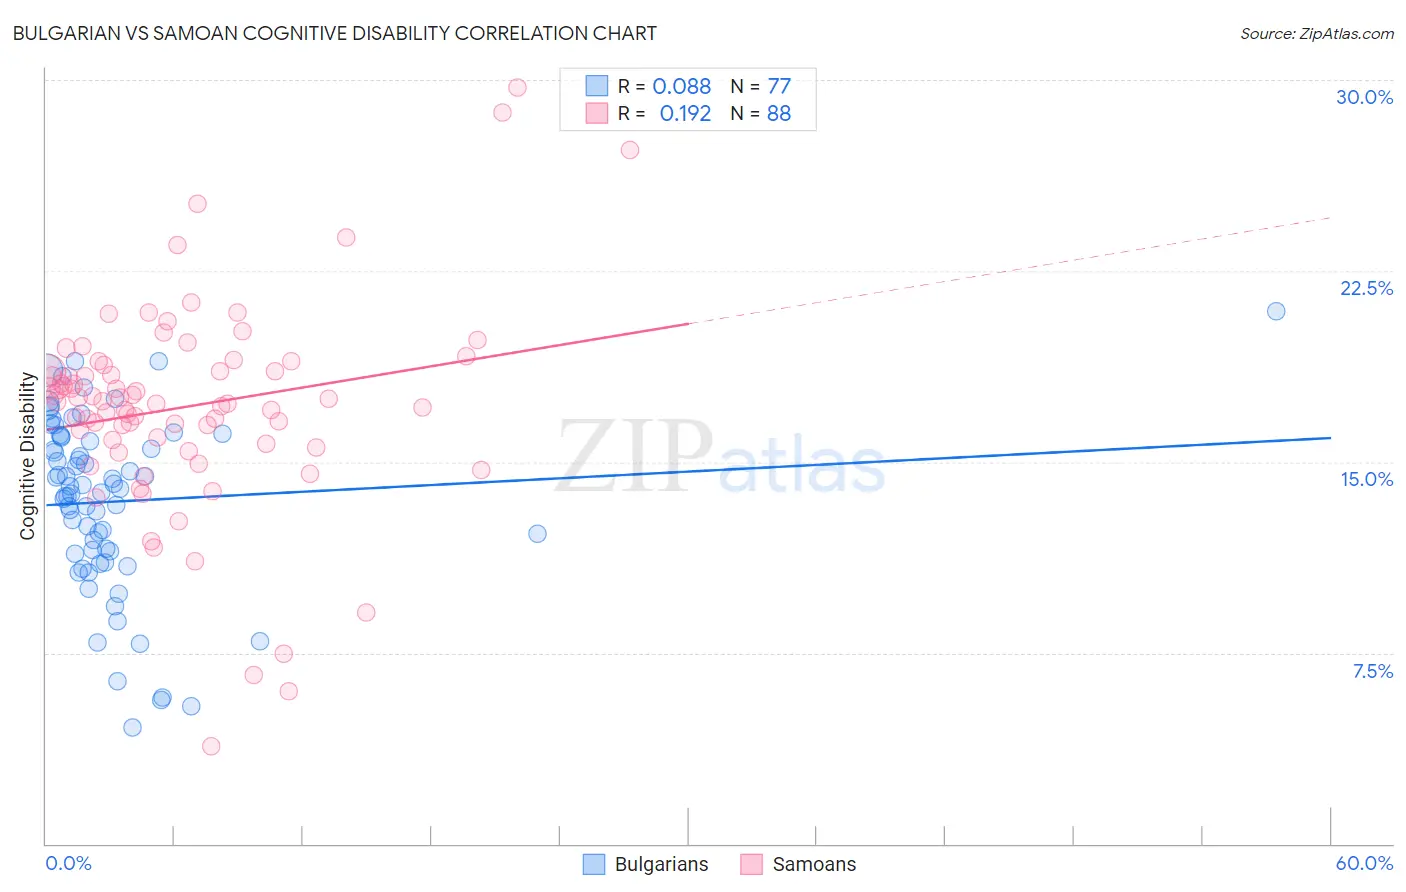
Bulgarian vs Samoan Cognitive Disability Correlation Chart
The statistical analysis conducted on geographies consisting of 205,630,797 people shows a slight positive correlation between the proportion of Bulgarians and percentage of population with cognitive disability in the United States with a correlation coefficient (R) of 0.088 and weighted average of 16.3%. Similarly, the statistical analysis conducted on geographies consisting of 225,130,180 people shows a poor positive correlation between the proportion of Samoans and percentage of population with cognitive disability in the United States with a correlation coefficient (R) of 0.192 and weighted average of 17.9%, a difference of 9.5%.
Cognitive Disability Correlation Summary
| Measurement | Bulgarian | Samoan |
| Minimum | 4.6% | 3.8% |
| Maximum | 20.9% | 29.7% |
| Range | 16.4% | 25.9% |
| Mean | 13.4% | 17.2% |
| Median | 14.0% | 17.4% |
| Interquartile 25% (IQ1) | 11.4% | 15.8% |
| Interquartile 75% (IQ3) | 16.0% | 18.7% |
| Interquartile Range (IQR) | 4.6% | 2.9% |
| Standard Deviation (Sample) | 3.4% | 4.1% |
| Standard Deviation (Population) | 3.4% | 4.1% |
Similar Demographics by Cognitive Disability
Demographics Similar to Bulgarians by Cognitive Disability
In terms of cognitive disability, the demographic groups most similar to Bulgarians are Immigrants from Bolivia (16.3%, a difference of 0.010%), Immigrants from Northern Europe (16.3%, a difference of 0.020%), Immigrants from Cuba (16.3%, a difference of 0.040%), Immigrants from North Macedonia (16.3%, a difference of 0.080%), and Eastern European (16.3%, a difference of 0.10%).
| Demographics | Rating | Rank | Cognitive Disability |
| Lithuanians | 100.0 /100 | #13 | Exceptional 16.3% |
| Immigrants | Austria | 100.0 /100 | #14 | Exceptional 16.3% |
| Immigrants | Greece | 100.0 /100 | #15 | Exceptional 16.3% |
| Eastern Europeans | 100.0 /100 | #16 | Exceptional 16.3% |
| Immigrants | North Macedonia | 100.0 /100 | #17 | Exceptional 16.3% |
| Immigrants | Northern Europe | 100.0 /100 | #18 | Exceptional 16.3% |
| Immigrants | Bolivia | 100.0 /100 | #19 | Exceptional 16.3% |
| Bulgarians | 100.0 /100 | #20 | Exceptional 16.3% |
| Immigrants | Cuba | 100.0 /100 | #21 | Exceptional 16.3% |
| Immigrants | South Central Asia | 99.9 /100 | #22 | Exceptional 16.4% |
| Croatians | 99.9 /100 | #23 | Exceptional 16.4% |
| Immigrants | Argentina | 99.9 /100 | #24 | Exceptional 16.4% |
| Luxembourgers | 99.9 /100 | #25 | Exceptional 16.4% |
| Immigrants | Croatia | 99.9 /100 | #26 | Exceptional 16.4% |
| Immigrants | Pakistan | 99.9 /100 | #27 | Exceptional 16.4% |
Demographics Similar to Samoans by Cognitive Disability
In terms of cognitive disability, the demographic groups most similar to Samoans are French American Indian (17.9%, a difference of 0.010%), Cree (17.9%, a difference of 0.060%), Immigrants from Ethiopia (17.9%, a difference of 0.060%), Immigrants from Thailand (17.9%, a difference of 0.070%), and Malaysian (17.9%, a difference of 0.070%).
| Demographics | Rating | Rank | Cognitive Disability |
| Iraqis | 1.4 /100 | #240 | Tragic 17.8% |
| Mexicans | 1.1 /100 | #241 | Tragic 17.8% |
| Paiute | 1.1 /100 | #242 | Tragic 17.8% |
| Immigrants | Bangladesh | 1.0 /100 | #243 | Tragic 17.8% |
| Jamaicans | 0.9 /100 | #244 | Tragic 17.9% |
| Trinidadians and Tobagonians | 0.8 /100 | #245 | Tragic 17.9% |
| Immigrants | Thailand | 0.8 /100 | #246 | Tragic 17.9% |
| Samoans | 0.7 /100 | #247 | Tragic 17.9% |
| French American Indians | 0.7 /100 | #248 | Tragic 17.9% |
| Cree | 0.7 /100 | #249 | Tragic 17.9% |
| Immigrants | Ethiopia | 0.7 /100 | #250 | Tragic 17.9% |
| Malaysians | 0.6 /100 | #251 | Tragic 17.9% |
| Immigrants | Grenada | 0.6 /100 | #252 | Tragic 17.9% |
| Hopi | 0.6 /100 | #253 | Tragic 17.9% |
| Hispanics or Latinos | 0.6 /100 | #254 | Tragic 17.9% |