Iranian vs Immigrants from Singapore Cognitive Disability
COMPARE
Iranian
Immigrants from Singapore
Cognitive Disability
Cognitive Disability Comparison
Iranians
Immigrants from Singapore
16.5%
COGNITIVE DISABILITY
99.8/ 100
METRIC RATING
49th/ 347
METRIC RANK
17.5%
COGNITIVE DISABILITY
14.3/ 100
METRIC RATING
199th/ 347
METRIC RANK
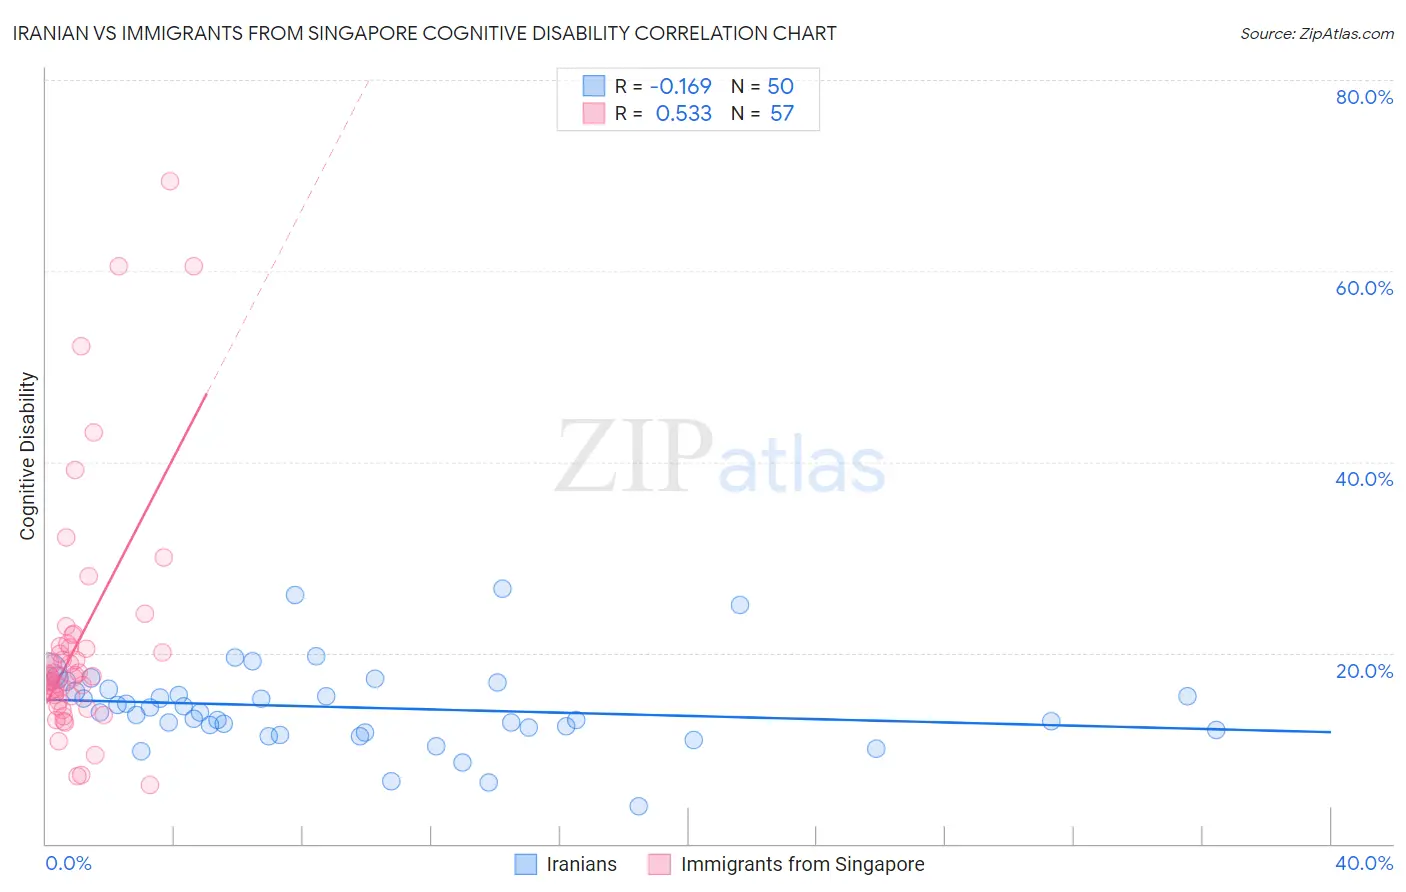
Iranian vs Immigrants from Singapore Cognitive Disability Correlation Chart
The statistical analysis conducted on geographies consisting of 316,831,164 people shows a poor negative correlation between the proportion of Iranians and percentage of population with cognitive disability in the United States with a correlation coefficient (R) of -0.169 and weighted average of 16.5%. Similarly, the statistical analysis conducted on geographies consisting of 137,519,920 people shows a substantial positive correlation between the proportion of Immigrants from Singapore and percentage of population with cognitive disability in the United States with a correlation coefficient (R) of 0.533 and weighted average of 17.5%, a difference of 6.0%.
Cognitive Disability Correlation Summary
| Measurement | Iranian | Immigrants from Singapore |
| Minimum | 3.9% | 6.1% |
| Maximum | 26.7% | 69.3% |
| Range | 22.8% | 63.2% |
| Mean | 14.3% | 21.2% |
| Median | 13.7% | 17.6% |
| Interquartile 25% (IQ1) | 11.9% | 15.2% |
| Interquartile 75% (IQ3) | 16.2% | 20.8% |
| Interquartile Range (IQR) | 4.3% | 5.6% |
| Standard Deviation (Sample) | 4.4% | 12.8% |
| Standard Deviation (Population) | 4.4% | 12.7% |
Similar Demographics by Cognitive Disability
Demographics Similar to Iranians by Cognitive Disability
In terms of cognitive disability, the demographic groups most similar to Iranians are Norwegian (16.5%, a difference of 0.010%), Immigrants from Italy (16.5%, a difference of 0.040%), Immigrants from North America (16.5%, a difference of 0.040%), Immigrants from Korea (16.5%, a difference of 0.050%), and Immigrants from Colombia (16.5%, a difference of 0.070%).
| Demographics | Rating | Rank | Cognitive Disability |
| Hungarians | 99.9 /100 | #42 | Exceptional 16.5% |
| Immigrants | Canada | 99.8 /100 | #43 | Exceptional 16.5% |
| Macedonians | 99.8 /100 | #44 | Exceptional 16.5% |
| Immigrants | Europe | 99.8 /100 | #45 | Exceptional 16.5% |
| Immigrants | Colombia | 99.8 /100 | #46 | Exceptional 16.5% |
| Immigrants | Italy | 99.8 /100 | #47 | Exceptional 16.5% |
| Immigrants | North America | 99.8 /100 | #48 | Exceptional 16.5% |
| Iranians | 99.8 /100 | #49 | Exceptional 16.5% |
| Norwegians | 99.8 /100 | #50 | Exceptional 16.5% |
| Immigrants | Korea | 99.8 /100 | #51 | Exceptional 16.5% |
| Soviet Union | 99.8 /100 | #52 | Exceptional 16.5% |
| Swedes | 99.8 /100 | #53 | Exceptional 16.5% |
| Immigrants | Iran | 99.8 /100 | #54 | Exceptional 16.5% |
| Immigrants | Venezuela | 99.7 /100 | #55 | Exceptional 16.5% |
| Austrians | 99.7 /100 | #56 | Exceptional 16.6% |
Demographics Similar to Immigrants from Singapore by Cognitive Disability
In terms of cognitive disability, the demographic groups most similar to Immigrants from Singapore are Haitian (17.5%, a difference of 0.010%), Immigrants from Panama (17.5%, a difference of 0.030%), South American Indian (17.5%, a difference of 0.080%), Immigrants from Afghanistan (17.5%, a difference of 0.13%), and Immigrants from Morocco (17.5%, a difference of 0.14%).
| Demographics | Rating | Rank | Cognitive Disability |
| Immigrants | Haiti | 27.1 /100 | #192 | Fair 17.4% |
| Delaware | 25.6 /100 | #193 | Fair 17.4% |
| Immigrants | Bosnia and Herzegovina | 22.0 /100 | #194 | Fair 17.4% |
| New Zealanders | 21.1 /100 | #195 | Fair 17.4% |
| Guyanese | 17.5 /100 | #196 | Poor 17.5% |
| Immigrants | Afghanistan | 16.7 /100 | #197 | Poor 17.5% |
| Immigrants | Panama | 14.8 /100 | #198 | Poor 17.5% |
| Immigrants | Singapore | 14.3 /100 | #199 | Poor 17.5% |
| Haitians | 14.1 /100 | #200 | Poor 17.5% |
| South American Indians | 13.0 /100 | #201 | Poor 17.5% |
| Immigrants | Morocco | 12.0 /100 | #202 | Poor 17.5% |
| Immigrants | Caribbean | 11.0 /100 | #203 | Poor 17.5% |
| Immigrants | Zimbabwe | 11.0 /100 | #204 | Poor 17.5% |
| Puget Sound Salish | 10.9 /100 | #205 | Poor 17.5% |
| Alaska Natives | 10.4 /100 | #206 | Poor 17.5% |