Iranian vs Immigrants from Turkey Cognitive Disability
COMPARE
Iranian
Immigrants from Turkey
Cognitive Disability
Cognitive Disability Comparison
Iranians
Immigrants from Turkey
16.5%
COGNITIVE DISABILITY
99.8/ 100
METRIC RATING
49th/ 347
METRIC RANK
17.2%
COGNITIVE DISABILITY
56.7/ 100
METRIC RATING
172nd/ 347
METRIC RANK
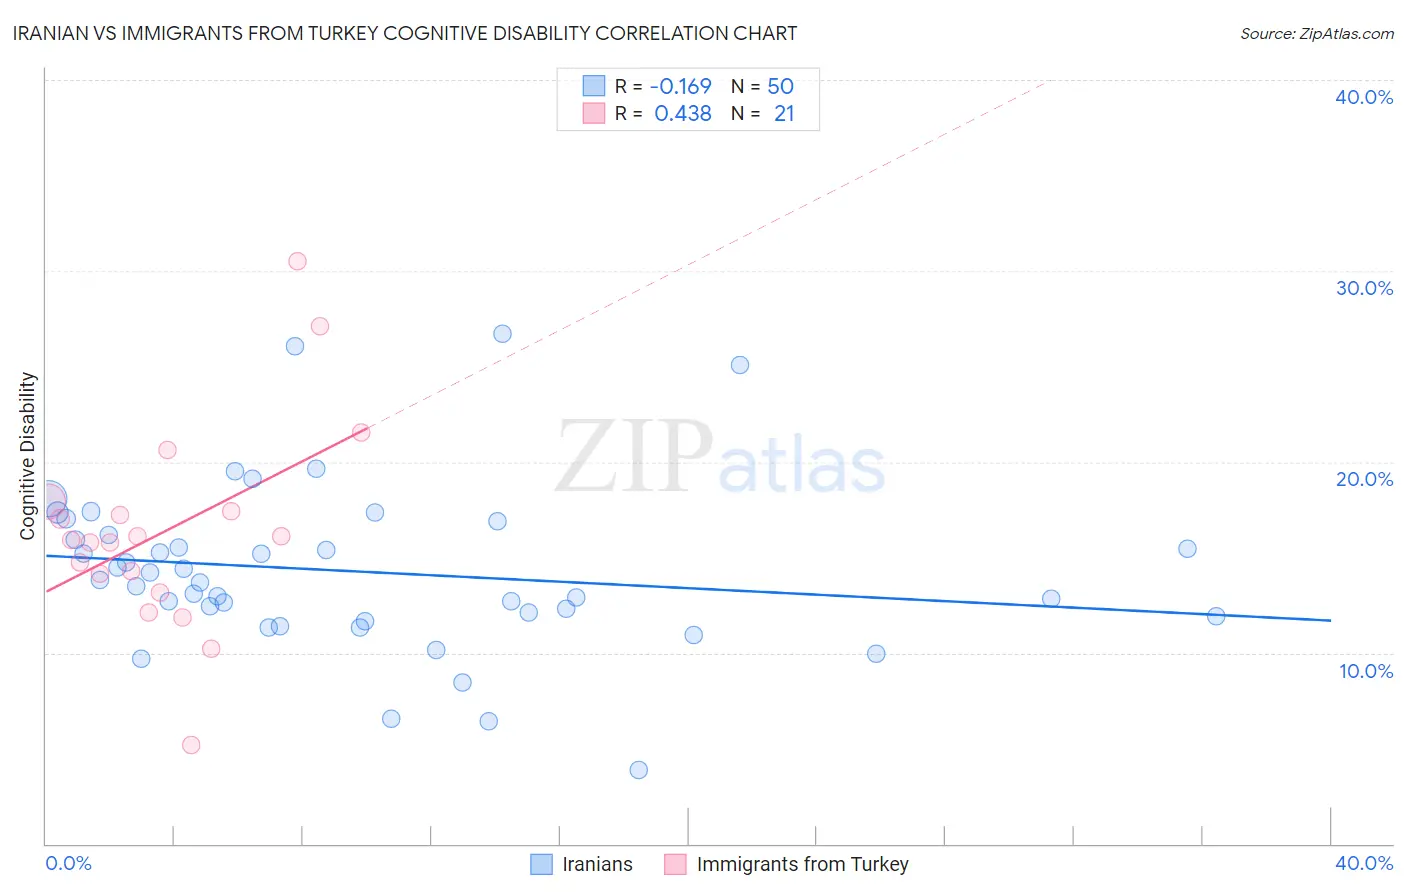
Iranian vs Immigrants from Turkey Cognitive Disability Correlation Chart
The statistical analysis conducted on geographies consisting of 316,831,164 people shows a poor negative correlation between the proportion of Iranians and percentage of population with cognitive disability in the United States with a correlation coefficient (R) of -0.169 and weighted average of 16.5%. Similarly, the statistical analysis conducted on geographies consisting of 223,051,603 people shows a moderate positive correlation between the proportion of Immigrants from Turkey and percentage of population with cognitive disability in the United States with a correlation coefficient (R) of 0.438 and weighted average of 17.2%, a difference of 4.5%.
Cognitive Disability Correlation Summary
| Measurement | Iranian | Immigrants from Turkey |
| Minimum | 3.9% | 5.2% |
| Maximum | 26.7% | 30.5% |
| Range | 22.8% | 25.3% |
| Mean | 14.3% | 16.4% |
| Median | 13.7% | 15.9% |
| Interquartile 25% (IQ1) | 11.9% | 13.7% |
| Interquartile 75% (IQ3) | 16.2% | 17.7% |
| Interquartile Range (IQR) | 4.3% | 4.0% |
| Standard Deviation (Sample) | 4.4% | 5.4% |
| Standard Deviation (Population) | 4.4% | 5.3% |
Similar Demographics by Cognitive Disability
Demographics Similar to Iranians by Cognitive Disability
In terms of cognitive disability, the demographic groups most similar to Iranians are Norwegian (16.5%, a difference of 0.010%), Immigrants from Italy (16.5%, a difference of 0.040%), Immigrants from North America (16.5%, a difference of 0.040%), Immigrants from Korea (16.5%, a difference of 0.050%), and Immigrants from Colombia (16.5%, a difference of 0.070%).
| Demographics | Rating | Rank | Cognitive Disability |
| Hungarians | 99.9 /100 | #42 | Exceptional 16.5% |
| Immigrants | Canada | 99.8 /100 | #43 | Exceptional 16.5% |
| Macedonians | 99.8 /100 | #44 | Exceptional 16.5% |
| Immigrants | Europe | 99.8 /100 | #45 | Exceptional 16.5% |
| Immigrants | Colombia | 99.8 /100 | #46 | Exceptional 16.5% |
| Immigrants | Italy | 99.8 /100 | #47 | Exceptional 16.5% |
| Immigrants | North America | 99.8 /100 | #48 | Exceptional 16.5% |
| Iranians | 99.8 /100 | #49 | Exceptional 16.5% |
| Norwegians | 99.8 /100 | #50 | Exceptional 16.5% |
| Immigrants | Korea | 99.8 /100 | #51 | Exceptional 16.5% |
| Soviet Union | 99.8 /100 | #52 | Exceptional 16.5% |
| Swedes | 99.8 /100 | #53 | Exceptional 16.5% |
| Immigrants | Iran | 99.8 /100 | #54 | Exceptional 16.5% |
| Immigrants | Venezuela | 99.7 /100 | #55 | Exceptional 16.5% |
| Austrians | 99.7 /100 | #56 | Exceptional 16.6% |
Demographics Similar to Immigrants from Turkey by Cognitive Disability
In terms of cognitive disability, the demographic groups most similar to Immigrants from Turkey are Tlingit-Haida (17.2%, a difference of 0.080%), Ecuadorian (17.2%, a difference of 0.090%), Immigrants from Portugal (17.2%, a difference of 0.15%), Immigrants (17.2%, a difference of 0.17%), and Immigrants from Northern Africa (17.3%, a difference of 0.18%).
| Demographics | Rating | Rank | Cognitive Disability |
| Immigrants | Albania | 64.9 /100 | #165 | Good 17.2% |
| Immigrants | Ecuador | 64.4 /100 | #166 | Good 17.2% |
| Immigrants | Syria | 63.5 /100 | #167 | Good 17.2% |
| Immigrants | Immigrants | 62.5 /100 | #168 | Good 17.2% |
| Immigrants | Portugal | 61.8 /100 | #169 | Good 17.2% |
| Ecuadorians | 59.6 /100 | #170 | Average 17.2% |
| Tlingit-Haida | 59.4 /100 | #171 | Average 17.2% |
| Immigrants | Turkey | 56.7 /100 | #172 | Average 17.2% |
| Immigrants | Northern Africa | 50.2 /100 | #173 | Average 17.3% |
| Laotians | 50.0 /100 | #174 | Average 17.3% |
| Tsimshian | 49.8 /100 | #175 | Average 17.3% |
| Shoshone | 49.2 /100 | #176 | Average 17.3% |
| Ute | 49.1 /100 | #177 | Average 17.3% |
| Spanish | 48.9 /100 | #178 | Average 17.3% |
| Sioux | 48.6 /100 | #179 | Average 17.3% |