Immigrants from Sri Lanka vs Samoan Cognitive Disability
COMPARE
Immigrants from Sri Lanka
Samoan
Cognitive Disability
Cognitive Disability Comparison
Immigrants from Sri Lanka
Samoans
16.8%
COGNITIVE DISABILITY
97.1/ 100
METRIC RATING
113th/ 347
METRIC RANK
17.9%
COGNITIVE DISABILITY
0.7/ 100
METRIC RATING
247th/ 347
METRIC RANK
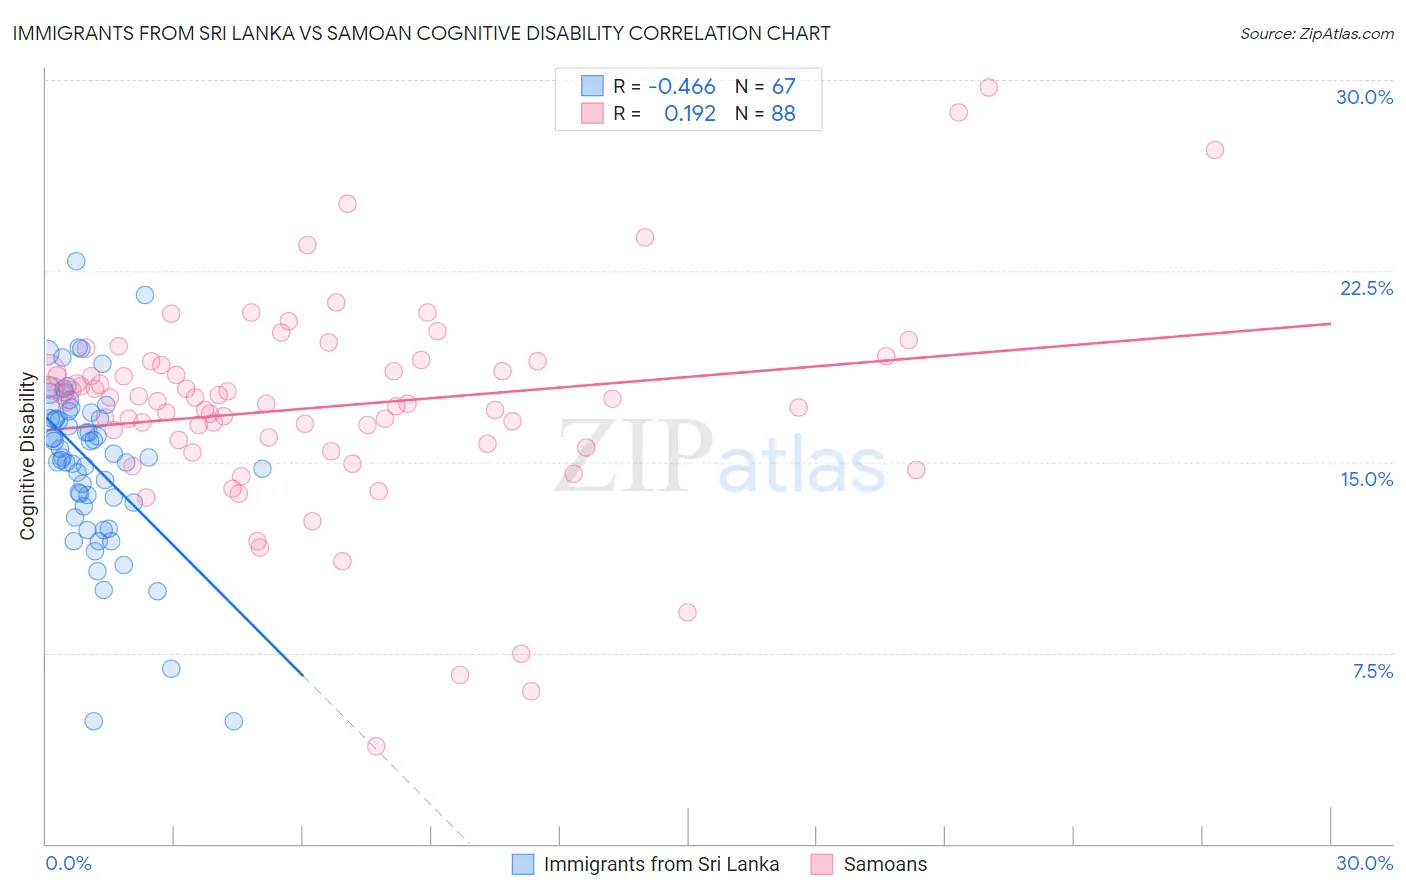
Immigrants from Sri Lanka vs Samoan Cognitive Disability Correlation Chart
The statistical analysis conducted on geographies consisting of 149,697,032 people shows a moderate negative correlation between the proportion of Immigrants from Sri Lanka and percentage of population with cognitive disability in the United States with a correlation coefficient (R) of -0.466 and weighted average of 16.8%. Similarly, the statistical analysis conducted on geographies consisting of 225,130,180 people shows a poor positive correlation between the proportion of Samoans and percentage of population with cognitive disability in the United States with a correlation coefficient (R) of 0.192 and weighted average of 17.9%, a difference of 6.2%.
Cognitive Disability Correlation Summary
| Measurement | Immigrants from Sri Lanka | Samoan |
| Minimum | 4.8% | 3.8% |
| Maximum | 22.9% | 29.7% |
| Range | 18.1% | 25.9% |
| Mean | 15.0% | 17.2% |
| Median | 15.3% | 17.4% |
| Interquartile 25% (IQ1) | 13.4% | 15.8% |
| Interquartile 75% (IQ3) | 17.0% | 18.7% |
| Interquartile Range (IQR) | 3.6% | 2.9% |
| Standard Deviation (Sample) | 3.3% | 4.1% |
| Standard Deviation (Population) | 3.3% | 4.1% |
Similar Demographics by Cognitive Disability
Demographics Similar to Immigrants from Sri Lanka by Cognitive Disability
In terms of cognitive disability, the demographic groups most similar to Immigrants from Sri Lanka are Indian (Asian) (16.8%, a difference of 0.0%), Korean (16.8%, a difference of 0.0%), Uruguayan (16.8%, a difference of 0.030%), Arapaho (16.8%, a difference of 0.040%), and Albanian (16.8%, a difference of 0.050%).
| Demographics | Rating | Rank | Cognitive Disability |
| Northern Europeans | 97.8 /100 | #106 | Exceptional 16.8% |
| Immigrants | Nicaragua | 97.8 /100 | #107 | Exceptional 16.8% |
| Canadians | 97.5 /100 | #108 | Exceptional 16.8% |
| Albanians | 97.3 /100 | #109 | Exceptional 16.8% |
| Arapaho | 97.3 /100 | #110 | Exceptional 16.8% |
| Uruguayans | 97.2 /100 | #111 | Exceptional 16.8% |
| Indians (Asian) | 97.2 /100 | #112 | Exceptional 16.8% |
| Immigrants | Sri Lanka | 97.1 /100 | #113 | Exceptional 16.8% |
| Koreans | 97.1 /100 | #114 | Exceptional 16.8% |
| Yup'ik | 96.9 /100 | #115 | Exceptional 16.9% |
| Inupiat | 96.5 /100 | #116 | Exceptional 16.9% |
| Immigrants | Japan | 96.2 /100 | #117 | Exceptional 16.9% |
| Immigrants | Denmark | 96.2 /100 | #118 | Exceptional 16.9% |
| South Africans | 95.5 /100 | #119 | Exceptional 16.9% |
| Scottish | 95.0 /100 | #120 | Exceptional 16.9% |
Demographics Similar to Samoans by Cognitive Disability
In terms of cognitive disability, the demographic groups most similar to Samoans are French American Indian (17.9%, a difference of 0.010%), Cree (17.9%, a difference of 0.060%), Immigrants from Ethiopia (17.9%, a difference of 0.060%), Immigrants from Thailand (17.9%, a difference of 0.070%), and Malaysian (17.9%, a difference of 0.070%).
| Demographics | Rating | Rank | Cognitive Disability |
| Iraqis | 1.4 /100 | #240 | Tragic 17.8% |
| Mexicans | 1.1 /100 | #241 | Tragic 17.8% |
| Paiute | 1.1 /100 | #242 | Tragic 17.8% |
| Immigrants | Bangladesh | 1.0 /100 | #243 | Tragic 17.8% |
| Jamaicans | 0.9 /100 | #244 | Tragic 17.9% |
| Trinidadians and Tobagonians | 0.8 /100 | #245 | Tragic 17.9% |
| Immigrants | Thailand | 0.8 /100 | #246 | Tragic 17.9% |
| Samoans | 0.7 /100 | #247 | Tragic 17.9% |
| French American Indians | 0.7 /100 | #248 | Tragic 17.9% |
| Cree | 0.7 /100 | #249 | Tragic 17.9% |
| Immigrants | Ethiopia | 0.7 /100 | #250 | Tragic 17.9% |
| Malaysians | 0.6 /100 | #251 | Tragic 17.9% |
| Immigrants | Grenada | 0.6 /100 | #252 | Tragic 17.9% |
| Hopi | 0.6 /100 | #253 | Tragic 17.9% |
| Hispanics or Latinos | 0.6 /100 | #254 | Tragic 17.9% |