Iranian vs Immigrants from Honduras Cognitive Disability
COMPARE
Iranian
Immigrants from Honduras
Cognitive Disability
Cognitive Disability Comparison
Iranians
Immigrants from Honduras
16.5%
COGNITIVE DISABILITY
99.8/ 100
METRIC RATING
49th/ 347
METRIC RANK
18.0%
COGNITIVE DISABILITY
0.2/ 100
METRIC RATING
272nd/ 347
METRIC RANK
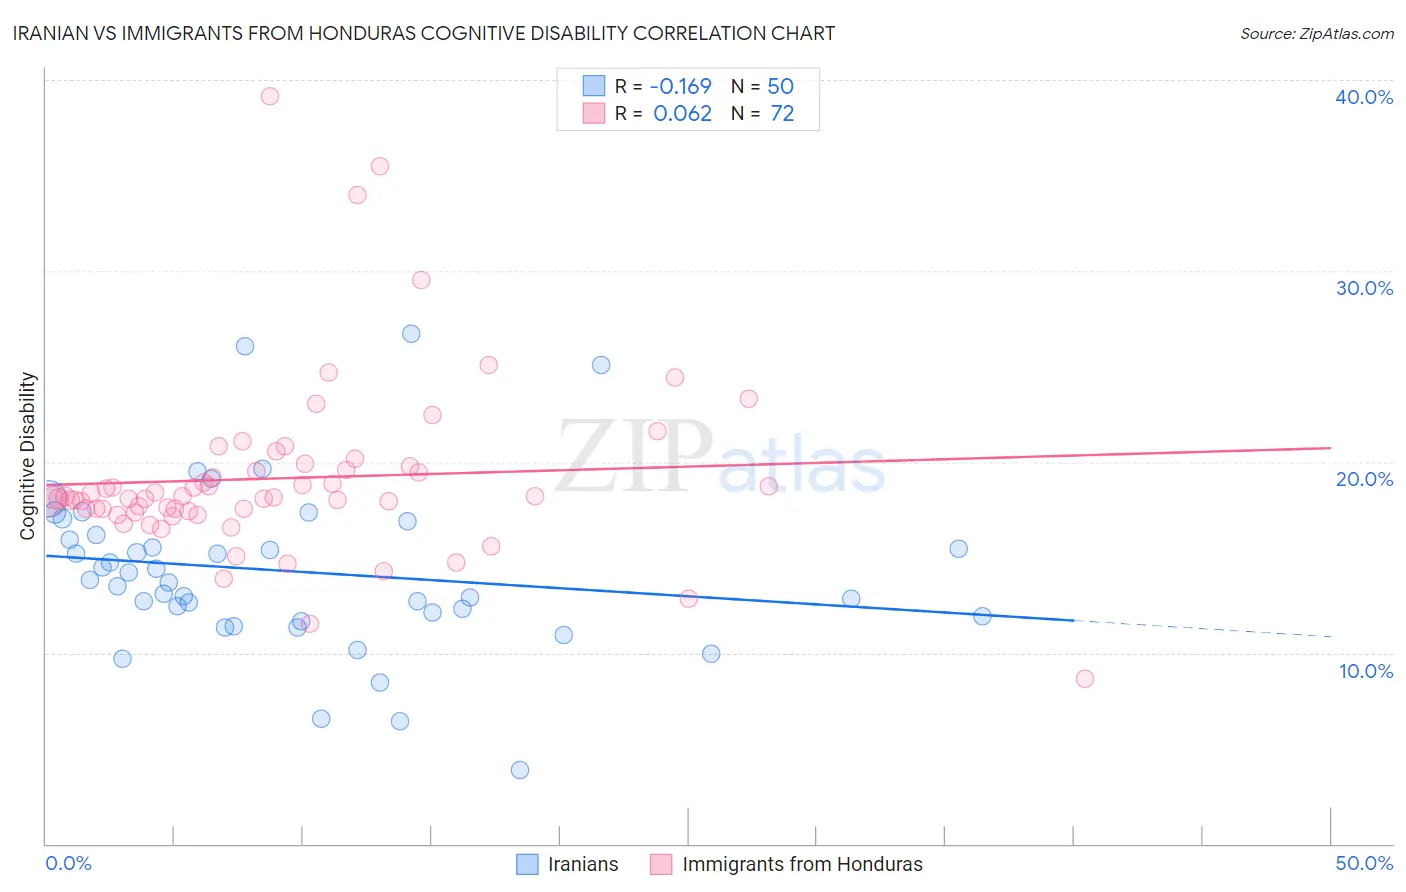
Iranian vs Immigrants from Honduras Cognitive Disability Correlation Chart
The statistical analysis conducted on geographies consisting of 316,831,164 people shows a poor negative correlation between the proportion of Iranians and percentage of population with cognitive disability in the United States with a correlation coefficient (R) of -0.169 and weighted average of 16.5%. Similarly, the statistical analysis conducted on geographies consisting of 322,550,797 people shows a slight positive correlation between the proportion of Immigrants from Honduras and percentage of population with cognitive disability in the United States with a correlation coefficient (R) of 0.062 and weighted average of 18.0%, a difference of 9.2%.
Cognitive Disability Correlation Summary
| Measurement | Iranian | Immigrants from Honduras |
| Minimum | 3.9% | 8.7% |
| Maximum | 26.7% | 39.1% |
| Range | 22.8% | 30.5% |
| Mean | 14.3% | 19.1% |
| Median | 13.7% | 18.1% |
| Interquartile 25% (IQ1) | 11.9% | 17.5% |
| Interquartile 75% (IQ3) | 16.2% | 19.7% |
| Interquartile Range (IQR) | 4.3% | 2.2% |
| Standard Deviation (Sample) | 4.4% | 4.7% |
| Standard Deviation (Population) | 4.4% | 4.7% |
Similar Demographics by Cognitive Disability
Demographics Similar to Iranians by Cognitive Disability
In terms of cognitive disability, the demographic groups most similar to Iranians are Norwegian (16.5%, a difference of 0.010%), Immigrants from Italy (16.5%, a difference of 0.040%), Immigrants from North America (16.5%, a difference of 0.040%), Immigrants from Korea (16.5%, a difference of 0.050%), and Immigrants from Colombia (16.5%, a difference of 0.070%).
| Demographics | Rating | Rank | Cognitive Disability |
| Hungarians | 99.9 /100 | #42 | Exceptional 16.5% |
| Immigrants | Canada | 99.8 /100 | #43 | Exceptional 16.5% |
| Macedonians | 99.8 /100 | #44 | Exceptional 16.5% |
| Immigrants | Europe | 99.8 /100 | #45 | Exceptional 16.5% |
| Immigrants | Colombia | 99.8 /100 | #46 | Exceptional 16.5% |
| Immigrants | Italy | 99.8 /100 | #47 | Exceptional 16.5% |
| Immigrants | North America | 99.8 /100 | #48 | Exceptional 16.5% |
| Iranians | 99.8 /100 | #49 | Exceptional 16.5% |
| Norwegians | 99.8 /100 | #50 | Exceptional 16.5% |
| Immigrants | Korea | 99.8 /100 | #51 | Exceptional 16.5% |
| Soviet Union | 99.8 /100 | #52 | Exceptional 16.5% |
| Swedes | 99.8 /100 | #53 | Exceptional 16.5% |
| Immigrants | Iran | 99.8 /100 | #54 | Exceptional 16.5% |
| Immigrants | Venezuela | 99.7 /100 | #55 | Exceptional 16.5% |
| Austrians | 99.7 /100 | #56 | Exceptional 16.6% |
Demographics Similar to Immigrants from Honduras by Cognitive Disability
In terms of cognitive disability, the demographic groups most similar to Immigrants from Honduras are Potawatomi (18.0%, a difference of 0.010%), Immigrants from Bahamas (18.0%, a difference of 0.090%), Honduran (18.0%, a difference of 0.10%), Immigrants from Nepal (18.0%, a difference of 0.12%), and Immigrants from Nigeria (18.0%, a difference of 0.13%).
| Demographics | Rating | Rank | Cognitive Disability |
| Spanish Americans | 0.4 /100 | #265 | Tragic 18.0% |
| Belizeans | 0.4 /100 | #266 | Tragic 18.0% |
| Nepalese | 0.3 /100 | #267 | Tragic 18.0% |
| Cherokee | 0.3 /100 | #268 | Tragic 18.0% |
| Hondurans | 0.3 /100 | #269 | Tragic 18.0% |
| Immigrants | Bahamas | 0.3 /100 | #270 | Tragic 18.0% |
| Potawatomi | 0.2 /100 | #271 | Tragic 18.0% |
| Immigrants | Honduras | 0.2 /100 | #272 | Tragic 18.0% |
| Immigrants | Nepal | 0.2 /100 | #273 | Tragic 18.0% |
| Immigrants | Nigeria | 0.2 /100 | #274 | Tragic 18.0% |
| Immigrants | Laos | 0.2 /100 | #275 | Tragic 18.1% |
| Yuman | 0.2 /100 | #276 | Tragic 18.1% |
| Immigrants | Kuwait | 0.2 /100 | #277 | Tragic 18.1% |
| Immigrants | Micronesia | 0.2 /100 | #278 | Tragic 18.1% |
| Chippewa | 0.1 /100 | #279 | Tragic 18.1% |