Potawatomi vs Samoan Cognitive Disability
COMPARE
Potawatomi
Samoan
Cognitive Disability
Cognitive Disability Comparison
Potawatomi
Samoans
18.0%
COGNITIVE DISABILITY
0.2/ 100
METRIC RATING
271st/ 347
METRIC RANK
17.9%
COGNITIVE DISABILITY
0.7/ 100
METRIC RATING
247th/ 347
METRIC RANK
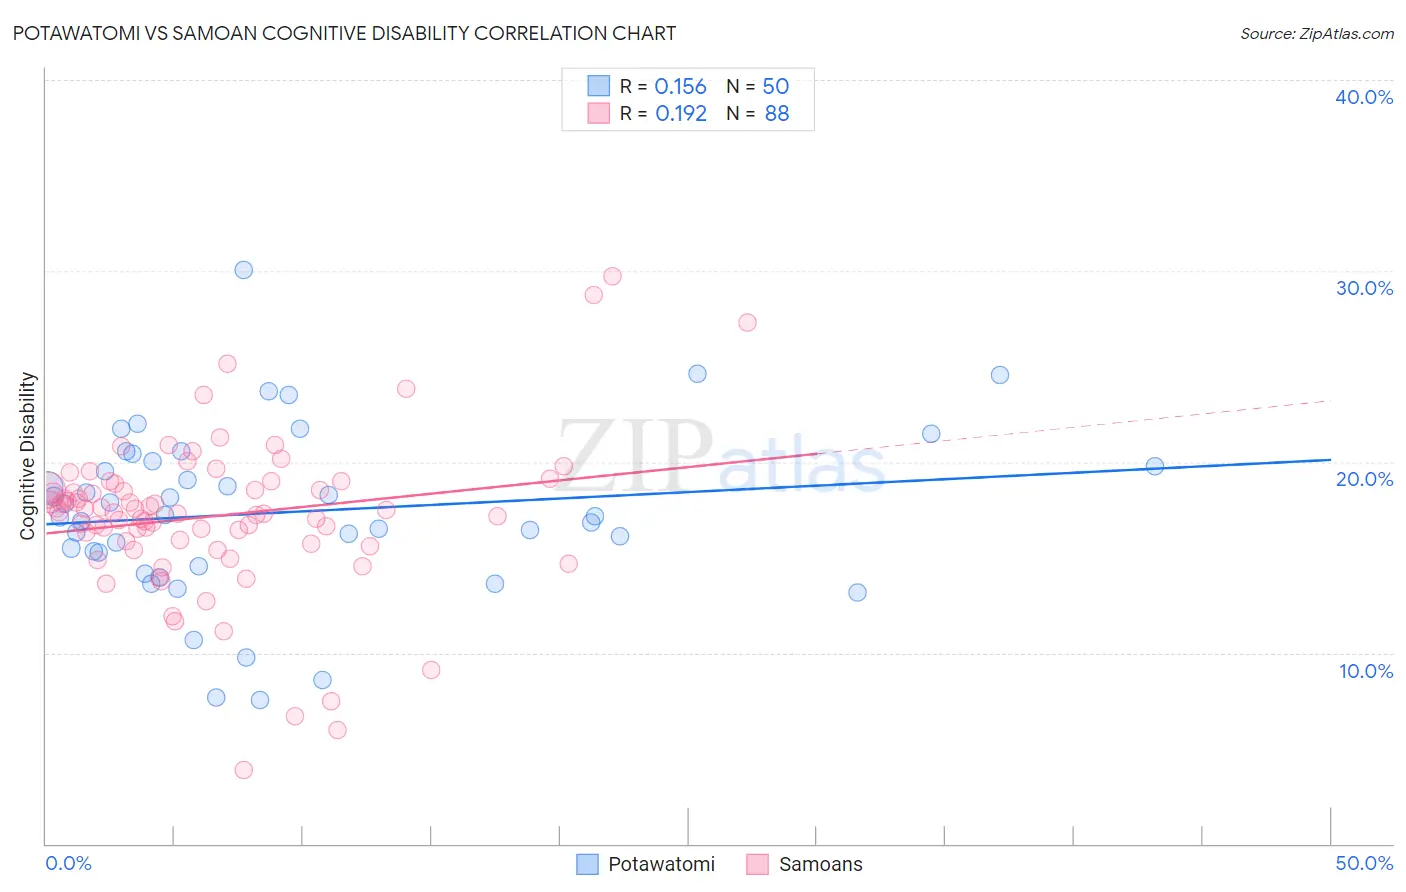
Potawatomi vs Samoan Cognitive Disability Correlation Chart
The statistical analysis conducted on geographies consisting of 117,767,379 people shows a poor positive correlation between the proportion of Potawatomi and percentage of population with cognitive disability in the United States with a correlation coefficient (R) of 0.156 and weighted average of 18.0%. Similarly, the statistical analysis conducted on geographies consisting of 225,130,180 people shows a poor positive correlation between the proportion of Samoans and percentage of population with cognitive disability in the United States with a correlation coefficient (R) of 0.192 and weighted average of 17.9%, a difference of 0.75%.
Cognitive Disability Correlation Summary
| Measurement | Potawatomi | Samoan |
| Minimum | 7.5% | 3.8% |
| Maximum | 30.0% | 29.7% |
| Range | 22.5% | 25.9% |
| Mean | 17.4% | 17.2% |
| Median | 17.2% | 17.4% |
| Interquartile 25% (IQ1) | 15.2% | 15.8% |
| Interquartile 75% (IQ3) | 20.0% | 18.7% |
| Interquartile Range (IQR) | 4.8% | 2.9% |
| Standard Deviation (Sample) | 4.4% | 4.1% |
| Standard Deviation (Population) | 4.4% | 4.1% |
Similar Demographics by Cognitive Disability
Demographics Similar to Potawatomi by Cognitive Disability
In terms of cognitive disability, the demographic groups most similar to Potawatomi are Immigrants from Honduras (18.0%, a difference of 0.010%), Immigrants from Bahamas (18.0%, a difference of 0.070%), Honduran (18.0%, a difference of 0.080%), Immigrants from Nepal (18.0%, a difference of 0.13%), and Immigrants from Nigeria (18.0%, a difference of 0.14%).
| Demographics | Rating | Rank | Cognitive Disability |
| Menominee | 0.4 /100 | #264 | Tragic 18.0% |
| Spanish Americans | 0.4 /100 | #265 | Tragic 18.0% |
| Belizeans | 0.4 /100 | #266 | Tragic 18.0% |
| Nepalese | 0.3 /100 | #267 | Tragic 18.0% |
| Cherokee | 0.3 /100 | #268 | Tragic 18.0% |
| Hondurans | 0.3 /100 | #269 | Tragic 18.0% |
| Immigrants | Bahamas | 0.3 /100 | #270 | Tragic 18.0% |
| Potawatomi | 0.2 /100 | #271 | Tragic 18.0% |
| Immigrants | Honduras | 0.2 /100 | #272 | Tragic 18.0% |
| Immigrants | Nepal | 0.2 /100 | #273 | Tragic 18.0% |
| Immigrants | Nigeria | 0.2 /100 | #274 | Tragic 18.0% |
| Immigrants | Laos | 0.2 /100 | #275 | Tragic 18.1% |
| Yuman | 0.2 /100 | #276 | Tragic 18.1% |
| Immigrants | Kuwait | 0.2 /100 | #277 | Tragic 18.1% |
| Immigrants | Micronesia | 0.2 /100 | #278 | Tragic 18.1% |
Demographics Similar to Samoans by Cognitive Disability
In terms of cognitive disability, the demographic groups most similar to Samoans are French American Indian (17.9%, a difference of 0.010%), Cree (17.9%, a difference of 0.060%), Immigrants from Ethiopia (17.9%, a difference of 0.060%), Immigrants from Thailand (17.9%, a difference of 0.070%), and Malaysian (17.9%, a difference of 0.070%).
| Demographics | Rating | Rank | Cognitive Disability |
| Iraqis | 1.4 /100 | #240 | Tragic 17.8% |
| Mexicans | 1.1 /100 | #241 | Tragic 17.8% |
| Paiute | 1.1 /100 | #242 | Tragic 17.8% |
| Immigrants | Bangladesh | 1.0 /100 | #243 | Tragic 17.8% |
| Jamaicans | 0.9 /100 | #244 | Tragic 17.9% |
| Trinidadians and Tobagonians | 0.8 /100 | #245 | Tragic 17.9% |
| Immigrants | Thailand | 0.8 /100 | #246 | Tragic 17.9% |
| Samoans | 0.7 /100 | #247 | Tragic 17.9% |
| French American Indians | 0.7 /100 | #248 | Tragic 17.9% |
| Cree | 0.7 /100 | #249 | Tragic 17.9% |
| Immigrants | Ethiopia | 0.7 /100 | #250 | Tragic 17.9% |
| Malaysians | 0.6 /100 | #251 | Tragic 17.9% |
| Immigrants | Grenada | 0.6 /100 | #252 | Tragic 17.9% |
| Hopi | 0.6 /100 | #253 | Tragic 17.9% |
| Hispanics or Latinos | 0.6 /100 | #254 | Tragic 17.9% |