Iranian vs Menominee Cognitive Disability
COMPARE
Iranian
Menominee
Cognitive Disability
Cognitive Disability Comparison
Iranians
Menominee
16.5%
COGNITIVE DISABILITY
99.8/ 100
METRIC RATING
49th/ 347
METRIC RANK
18.0%
COGNITIVE DISABILITY
0.4/ 100
METRIC RATING
264th/ 347
METRIC RANK
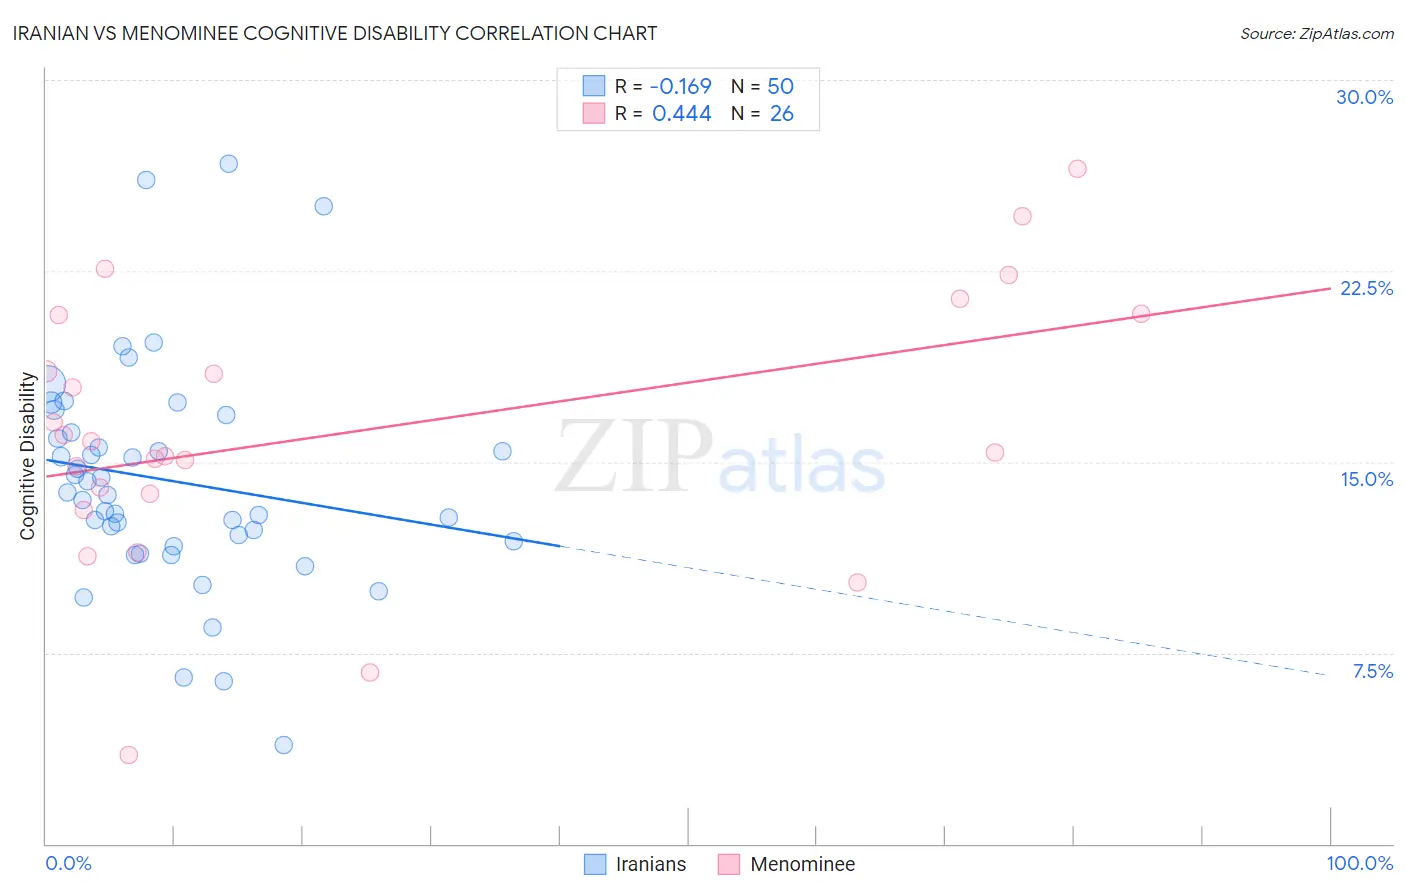
Iranian vs Menominee Cognitive Disability Correlation Chart
The statistical analysis conducted on geographies consisting of 316,831,164 people shows a poor negative correlation between the proportion of Iranians and percentage of population with cognitive disability in the United States with a correlation coefficient (R) of -0.169 and weighted average of 16.5%. Similarly, the statistical analysis conducted on geographies consisting of 45,777,849 people shows a moderate positive correlation between the proportion of Menominee and percentage of population with cognitive disability in the United States with a correlation coefficient (R) of 0.444 and weighted average of 18.0%, a difference of 8.8%.
Cognitive Disability Correlation Summary
| Measurement | Iranian | Menominee |
| Minimum | 3.9% | 3.5% |
| Maximum | 26.7% | 26.5% |
| Range | 22.8% | 23.0% |
| Mean | 14.3% | 16.2% |
| Median | 13.7% | 15.6% |
| Interquartile 25% (IQ1) | 11.9% | 13.7% |
| Interquartile 75% (IQ3) | 16.2% | 20.8% |
| Interquartile Range (IQR) | 4.3% | 7.0% |
| Standard Deviation (Sample) | 4.4% | 5.3% |
| Standard Deviation (Population) | 4.4% | 5.2% |
Similar Demographics by Cognitive Disability
Demographics Similar to Iranians by Cognitive Disability
In terms of cognitive disability, the demographic groups most similar to Iranians are Norwegian (16.5%, a difference of 0.010%), Immigrants from Italy (16.5%, a difference of 0.040%), Immigrants from North America (16.5%, a difference of 0.040%), Immigrants from Korea (16.5%, a difference of 0.050%), and Immigrants from Colombia (16.5%, a difference of 0.070%).
| Demographics | Rating | Rank | Cognitive Disability |
| Hungarians | 99.9 /100 | #42 | Exceptional 16.5% |
| Immigrants | Canada | 99.8 /100 | #43 | Exceptional 16.5% |
| Macedonians | 99.8 /100 | #44 | Exceptional 16.5% |
| Immigrants | Europe | 99.8 /100 | #45 | Exceptional 16.5% |
| Immigrants | Colombia | 99.8 /100 | #46 | Exceptional 16.5% |
| Immigrants | Italy | 99.8 /100 | #47 | Exceptional 16.5% |
| Immigrants | North America | 99.8 /100 | #48 | Exceptional 16.5% |
| Iranians | 99.8 /100 | #49 | Exceptional 16.5% |
| Norwegians | 99.8 /100 | #50 | Exceptional 16.5% |
| Immigrants | Korea | 99.8 /100 | #51 | Exceptional 16.5% |
| Soviet Union | 99.8 /100 | #52 | Exceptional 16.5% |
| Swedes | 99.8 /100 | #53 | Exceptional 16.5% |
| Immigrants | Iran | 99.8 /100 | #54 | Exceptional 16.5% |
| Immigrants | Venezuela | 99.7 /100 | #55 | Exceptional 16.5% |
| Austrians | 99.7 /100 | #56 | Exceptional 16.6% |
Demographics Similar to Menominee by Cognitive Disability
In terms of cognitive disability, the demographic groups most similar to Menominee are Spanish American (18.0%, a difference of 0.030%), Belizean (18.0%, a difference of 0.030%), Immigrants from Barbados (17.9%, a difference of 0.060%), Nepalese (18.0%, a difference of 0.090%), and Sierra Leonean (17.9%, a difference of 0.10%).
| Demographics | Rating | Rank | Cognitive Disability |
| Mexican American Indians | 0.6 /100 | #257 | Tragic 17.9% |
| Immigrants | Armenia | 0.6 /100 | #258 | Tragic 17.9% |
| Ethiopians | 0.5 /100 | #259 | Tragic 17.9% |
| Immigrants | Belize | 0.5 /100 | #260 | Tragic 17.9% |
| Guamanians/Chamorros | 0.5 /100 | #261 | Tragic 17.9% |
| Sierra Leoneans | 0.4 /100 | #262 | Tragic 17.9% |
| Immigrants | Barbados | 0.4 /100 | #263 | Tragic 17.9% |
| Menominee | 0.4 /100 | #264 | Tragic 18.0% |
| Spanish Americans | 0.4 /100 | #265 | Tragic 18.0% |
| Belizeans | 0.4 /100 | #266 | Tragic 18.0% |
| Nepalese | 0.3 /100 | #267 | Tragic 18.0% |
| Cherokee | 0.3 /100 | #268 | Tragic 18.0% |
| Hondurans | 0.3 /100 | #269 | Tragic 18.0% |
| Immigrants | Bahamas | 0.3 /100 | #270 | Tragic 18.0% |
| Potawatomi | 0.2 /100 | #271 | Tragic 18.0% |