Iranian vs Immigrants from Ukraine Cognitive Disability
COMPARE
Iranian
Immigrants from Ukraine
Cognitive Disability
Cognitive Disability Comparison
Iranians
Immigrants from Ukraine
16.5%
COGNITIVE DISABILITY
99.8/ 100
METRIC RATING
49th/ 347
METRIC RANK
16.6%
COGNITIVE DISABILITY
99.5/ 100
METRIC RATING
66th/ 347
METRIC RANK
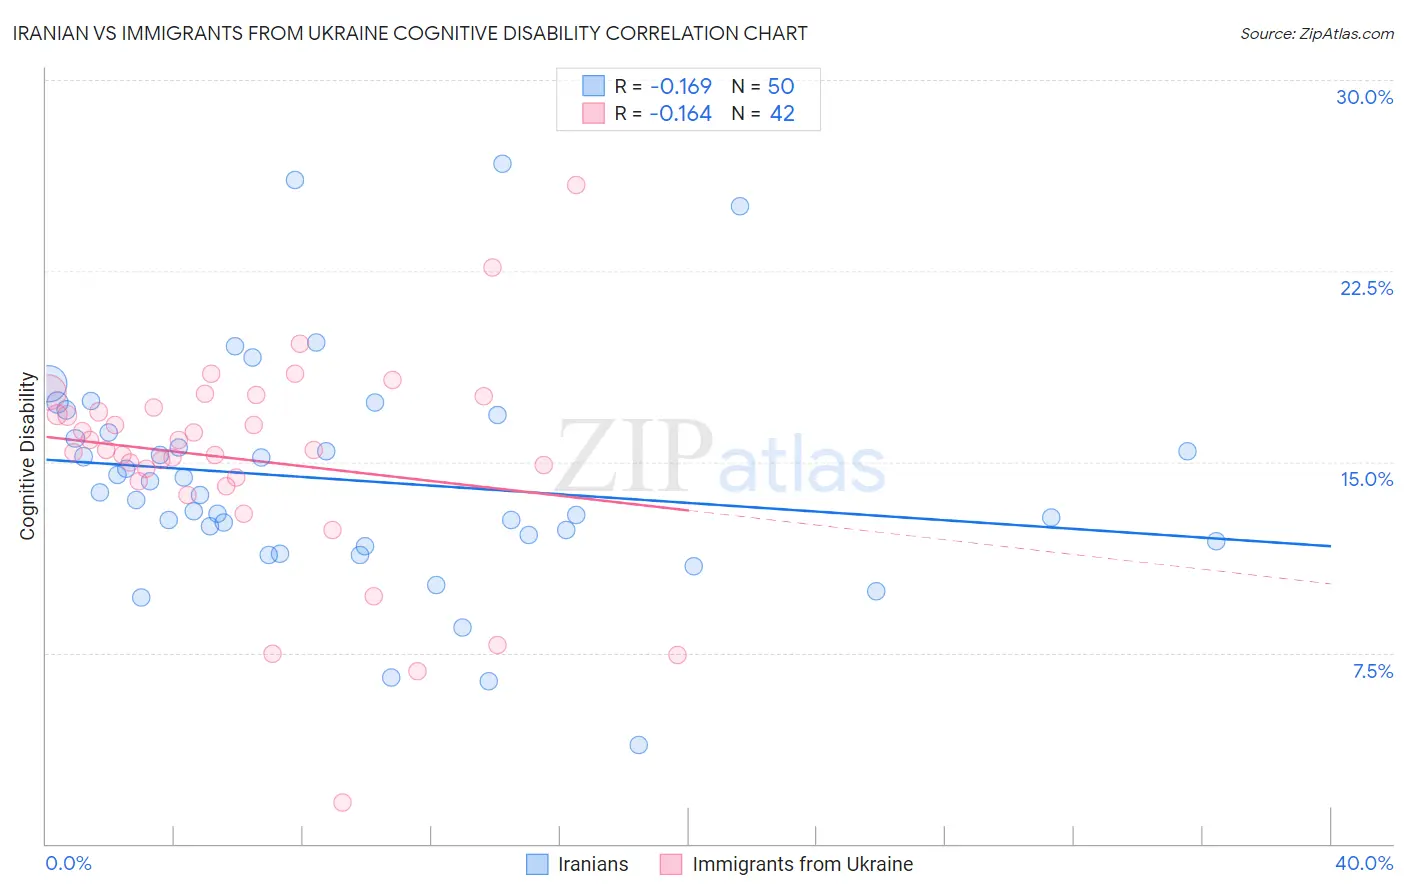
Iranian vs Immigrants from Ukraine Cognitive Disability Correlation Chart
The statistical analysis conducted on geographies consisting of 316,831,164 people shows a poor negative correlation between the proportion of Iranians and percentage of population with cognitive disability in the United States with a correlation coefficient (R) of -0.169 and weighted average of 16.5%. Similarly, the statistical analysis conducted on geographies consisting of 289,689,881 people shows a poor negative correlation between the proportion of Immigrants from Ukraine and percentage of population with cognitive disability in the United States with a correlation coefficient (R) of -0.164 and weighted average of 16.6%, a difference of 0.78%.
Cognitive Disability Correlation Summary
| Measurement | Iranian | Immigrants from Ukraine |
| Minimum | 3.9% | 1.6% |
| Maximum | 26.7% | 25.9% |
| Range | 22.8% | 24.3% |
| Mean | 14.3% | 15.1% |
| Median | 13.7% | 15.5% |
| Interquartile 25% (IQ1) | 11.9% | 14.3% |
| Interquartile 75% (IQ3) | 16.2% | 17.1% |
| Interquartile Range (IQR) | 4.3% | 2.9% |
| Standard Deviation (Sample) | 4.4% | 4.2% |
| Standard Deviation (Population) | 4.4% | 4.2% |
Demographics Similar to Iranians and Immigrants from Ukraine by Cognitive Disability
In terms of cognitive disability, the demographic groups most similar to Iranians are Norwegian (16.5%, a difference of 0.010%), Immigrants from Italy (16.5%, a difference of 0.040%), Immigrants from North America (16.5%, a difference of 0.040%), Immigrants from Korea (16.5%, a difference of 0.050%), and Soviet Union (16.5%, a difference of 0.090%). Similarly, the demographic groups most similar to Immigrants from Ukraine are Latvian (16.6%, a difference of 0.040%), Colombian (16.6%, a difference of 0.12%), Venezuelan (16.6%, a difference of 0.14%), Argentinean (16.6%, a difference of 0.20%), and Czechoslovakian (16.6%, a difference of 0.22%).
| Demographics | Rating | Rank | Cognitive Disability |
| Immigrants | Italy | 99.8 /100 | #47 | Exceptional 16.5% |
| Immigrants | North America | 99.8 /100 | #48 | Exceptional 16.5% |
| Iranians | 99.8 /100 | #49 | Exceptional 16.5% |
| Norwegians | 99.8 /100 | #50 | Exceptional 16.5% |
| Immigrants | Korea | 99.8 /100 | #51 | Exceptional 16.5% |
| Soviet Union | 99.8 /100 | #52 | Exceptional 16.5% |
| Swedes | 99.8 /100 | #53 | Exceptional 16.5% |
| Immigrants | Iran | 99.8 /100 | #54 | Exceptional 16.5% |
| Immigrants | Venezuela | 99.7 /100 | #55 | Exceptional 16.5% |
| Austrians | 99.7 /100 | #56 | Exceptional 16.6% |
| Bhutanese | 99.7 /100 | #57 | Exceptional 16.6% |
| Pennsylvania Germans | 99.7 /100 | #58 | Exceptional 16.6% |
| Immigrants | Peru | 99.7 /100 | #59 | Exceptional 16.6% |
| Romanians | 99.7 /100 | #60 | Exceptional 16.6% |
| Immigrants | England | 99.6 /100 | #61 | Exceptional 16.6% |
| Czechoslovakians | 99.6 /100 | #62 | Exceptional 16.6% |
| Argentineans | 99.6 /100 | #63 | Exceptional 16.6% |
| Venezuelans | 99.6 /100 | #64 | Exceptional 16.6% |
| Colombians | 99.6 /100 | #65 | Exceptional 16.6% |
| Immigrants | Ukraine | 99.5 /100 | #66 | Exceptional 16.6% |
| Latvians | 99.5 /100 | #67 | Exceptional 16.6% |