Iranian vs Immigrants from Costa Rica Hearing Disability
COMPARE
Iranian
Immigrants from Costa Rica
Hearing Disability
Hearing Disability Comparison
Iranians
Immigrants from Costa Rica
2.8%
HEARING DISABILITY
96.4/ 100
METRIC RATING
92nd/ 347
METRIC RANK
2.9%
HEARING DISABILITY
84.0/ 100
METRIC RATING
138th/ 347
METRIC RANK
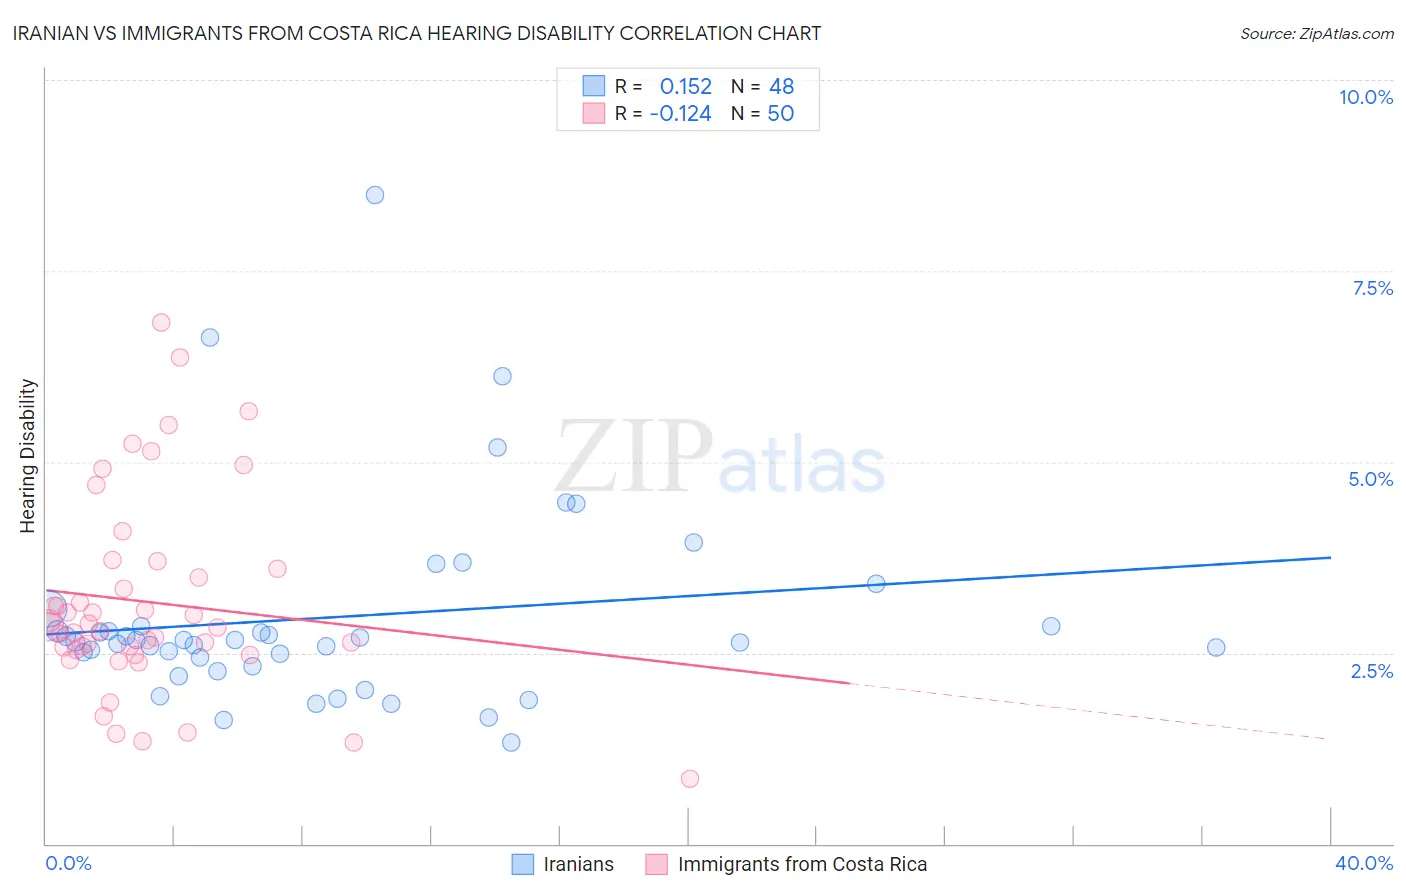
Iranian vs Immigrants from Costa Rica Hearing Disability Correlation Chart
The statistical analysis conducted on geographies consisting of 316,808,830 people shows a poor positive correlation between the proportion of Iranians and percentage of population with hearing disability in the United States with a correlation coefficient (R) of 0.152 and weighted average of 2.8%. Similarly, the statistical analysis conducted on geographies consisting of 204,259,714 people shows a poor negative correlation between the proportion of Immigrants from Costa Rica and percentage of population with hearing disability in the United States with a correlation coefficient (R) of -0.124 and weighted average of 2.9%, a difference of 4.2%.
Hearing Disability Correlation Summary
| Measurement | Iranian | Immigrants from Costa Rica |
| Minimum | 1.3% | 0.86% |
| Maximum | 8.5% | 6.8% |
| Range | 7.2% | 6.0% |
| Mean | 3.0% | 3.2% |
| Median | 2.7% | 2.8% |
| Interquartile 25% (IQ1) | 2.4% | 2.5% |
| Interquartile 75% (IQ3) | 2.8% | 3.6% |
| Interquartile Range (IQR) | 0.46% | 1.1% |
| Standard Deviation (Sample) | 1.3% | 1.3% |
| Standard Deviation (Population) | 1.3% | 1.3% |
Similar Demographics by Hearing Disability
Demographics Similar to Iranians by Hearing Disability
In terms of hearing disability, the demographic groups most similar to Iranians are Immigrants from Middle Africa (2.8%, a difference of 0.030%), Immigrants from Morocco (2.8%, a difference of 0.11%), Immigrants from Kuwait (2.8%, a difference of 0.12%), Belizean (2.8%, a difference of 0.14%), and Immigrants from Turkey (2.8%, a difference of 0.17%).
| Demographics | Rating | Rank | Hearing Disability |
| Immigrants | Northern Africa | 96.9 /100 | #85 | Exceptional 2.8% |
| Immigrants | Iran | 96.8 /100 | #86 | Exceptional 2.8% |
| Somalis | 96.7 /100 | #87 | Exceptional 2.8% |
| Immigrants | Turkey | 96.7 /100 | #88 | Exceptional 2.8% |
| Belizeans | 96.6 /100 | #89 | Exceptional 2.8% |
| Immigrants | Morocco | 96.6 /100 | #90 | Exceptional 2.8% |
| Immigrants | Middle Africa | 96.5 /100 | #91 | Exceptional 2.8% |
| Iranians | 96.4 /100 | #92 | Exceptional 2.8% |
| Immigrants | Kuwait | 96.3 /100 | #93 | Exceptional 2.8% |
| Uruguayans | 95.9 /100 | #94 | Exceptional 2.8% |
| Israelis | 95.9 /100 | #95 | Exceptional 2.8% |
| Immigrants | Somalia | 95.5 /100 | #96 | Exceptional 2.8% |
| Immigrants | Afghanistan | 95.3 /100 | #97 | Exceptional 2.8% |
| Immigrants | Honduras | 95.1 /100 | #98 | Exceptional 2.8% |
| Immigrants | Guatemala | 95.1 /100 | #99 | Exceptional 2.8% |
Demographics Similar to Immigrants from Costa Rica by Hearing Disability
In terms of hearing disability, the demographic groups most similar to Immigrants from Costa Rica are Sri Lankan (2.9%, a difference of 0.010%), Bermudan (2.9%, a difference of 0.050%), Immigrants from Jordan (2.9%, a difference of 0.060%), Immigrants from Brazil (2.9%, a difference of 0.10%), and Soviet Union (2.9%, a difference of 0.13%).
| Demographics | Rating | Rank | Hearing Disability |
| Immigrants | Kenya | 86.1 /100 | #131 | Excellent 2.9% |
| Chileans | 85.8 /100 | #132 | Excellent 2.9% |
| Immigrants | Syria | 85.8 /100 | #133 | Excellent 2.9% |
| Ugandans | 85.5 /100 | #134 | Excellent 2.9% |
| Soviet Union | 84.8 /100 | #135 | Excellent 2.9% |
| Immigrants | Brazil | 84.6 /100 | #136 | Excellent 2.9% |
| Sri Lankans | 84.1 /100 | #137 | Excellent 2.9% |
| Immigrants | Costa Rica | 84.0 /100 | #138 | Excellent 2.9% |
| Bermudans | 83.8 /100 | #139 | Excellent 2.9% |
| Immigrants | Jordan | 83.7 /100 | #140 | Excellent 2.9% |
| Sub-Saharan Africans | 83.3 /100 | #141 | Excellent 2.9% |
| Laotians | 81.1 /100 | #142 | Excellent 2.9% |
| Immigrants | Bahamas | 80.9 /100 | #143 | Excellent 2.9% |
| Immigrants | Bulgaria | 79.2 /100 | #144 | Good 2.9% |
| Immigrants | Congo | 78.9 /100 | #145 | Good 2.9% |