Iranian vs Tlingit-Haida Hearing Disability
COMPARE
Iranian
Tlingit-Haida
Hearing Disability
Hearing Disability Comparison
Iranians
Tlingit-Haida
2.8%
HEARING DISABILITY
96.4/ 100
METRIC RATING
92nd/ 347
METRIC RANK
4.8%
HEARING DISABILITY
0.0/ 100
METRIC RATING
344th/ 347
METRIC RANK
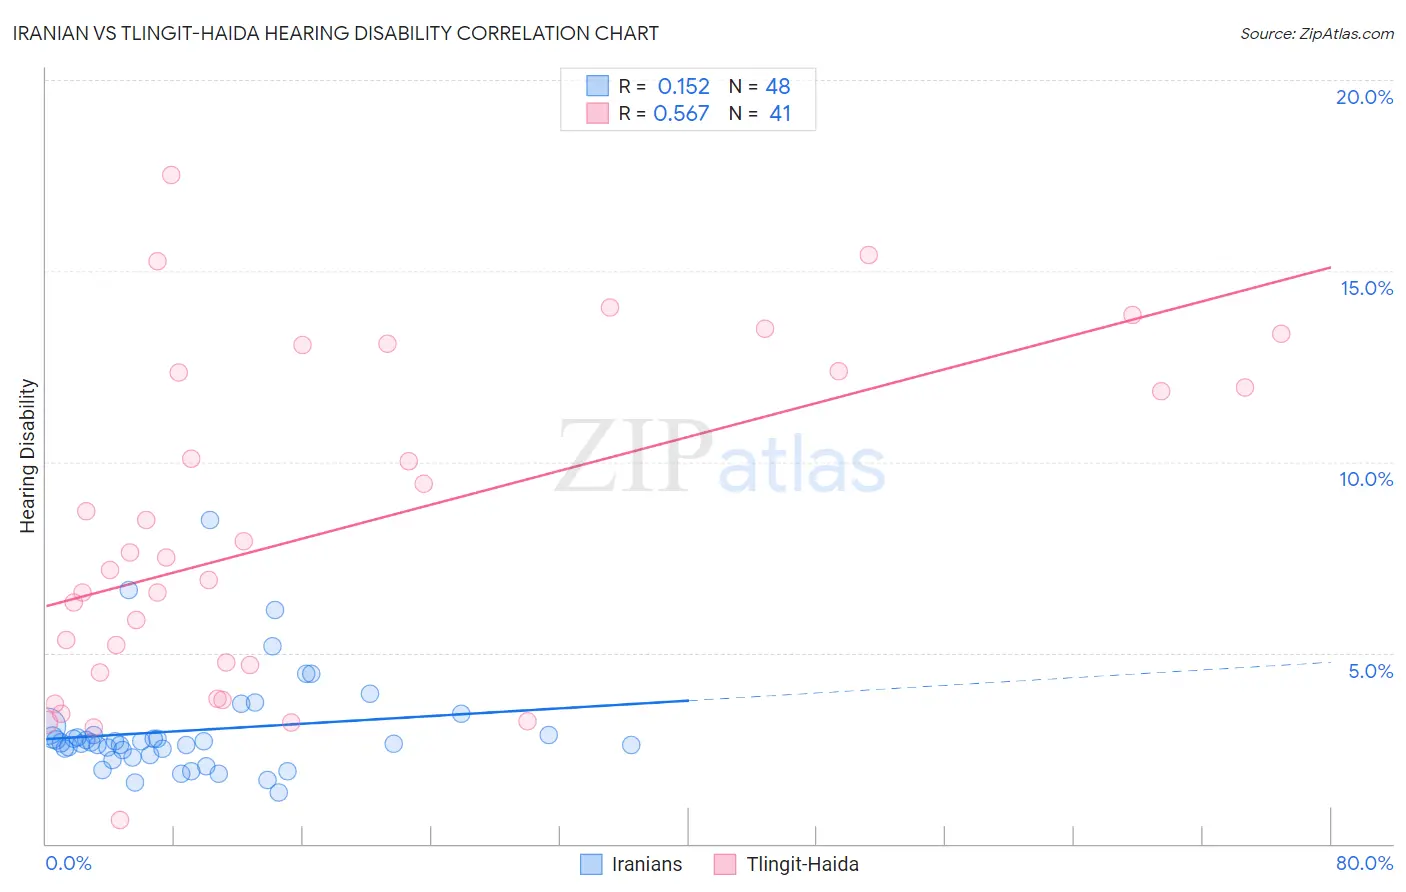
Iranian vs Tlingit-Haida Hearing Disability Correlation Chart
The statistical analysis conducted on geographies consisting of 316,808,830 people shows a poor positive correlation between the proportion of Iranians and percentage of population with hearing disability in the United States with a correlation coefficient (R) of 0.152 and weighted average of 2.8%. Similarly, the statistical analysis conducted on geographies consisting of 60,852,790 people shows a substantial positive correlation between the proportion of Tlingit-Haida and percentage of population with hearing disability in the United States with a correlation coefficient (R) of 0.567 and weighted average of 4.8%, a difference of 75.3%.
Hearing Disability Correlation Summary
| Measurement | Iranian | Tlingit-Haida |
| Minimum | 1.3% | 0.61% |
| Maximum | 8.5% | 17.5% |
| Range | 7.2% | 16.9% |
| Mean | 3.0% | 8.3% |
| Median | 2.7% | 7.5% |
| Interquartile 25% (IQ1) | 2.4% | 4.6% |
| Interquartile 75% (IQ3) | 2.8% | 12.4% |
| Interquartile Range (IQR) | 0.46% | 7.8% |
| Standard Deviation (Sample) | 1.3% | 4.3% |
| Standard Deviation (Population) | 1.3% | 4.3% |
Similar Demographics by Hearing Disability
Demographics Similar to Iranians by Hearing Disability
In terms of hearing disability, the demographic groups most similar to Iranians are Immigrants from Middle Africa (2.8%, a difference of 0.030%), Immigrants from Morocco (2.8%, a difference of 0.11%), Immigrants from Kuwait (2.8%, a difference of 0.12%), Belizean (2.8%, a difference of 0.14%), and Immigrants from Turkey (2.8%, a difference of 0.17%).
| Demographics | Rating | Rank | Hearing Disability |
| Immigrants | Northern Africa | 96.9 /100 | #85 | Exceptional 2.8% |
| Immigrants | Iran | 96.8 /100 | #86 | Exceptional 2.8% |
| Somalis | 96.7 /100 | #87 | Exceptional 2.8% |
| Immigrants | Turkey | 96.7 /100 | #88 | Exceptional 2.8% |
| Belizeans | 96.6 /100 | #89 | Exceptional 2.8% |
| Immigrants | Morocco | 96.6 /100 | #90 | Exceptional 2.8% |
| Immigrants | Middle Africa | 96.5 /100 | #91 | Exceptional 2.8% |
| Iranians | 96.4 /100 | #92 | Exceptional 2.8% |
| Immigrants | Kuwait | 96.3 /100 | #93 | Exceptional 2.8% |
| Uruguayans | 95.9 /100 | #94 | Exceptional 2.8% |
| Israelis | 95.9 /100 | #95 | Exceptional 2.8% |
| Immigrants | Somalia | 95.5 /100 | #96 | Exceptional 2.8% |
| Immigrants | Afghanistan | 95.3 /100 | #97 | Exceptional 2.8% |
| Immigrants | Honduras | 95.1 /100 | #98 | Exceptional 2.8% |
| Immigrants | Guatemala | 95.1 /100 | #99 | Exceptional 2.8% |
Demographics Similar to Tlingit-Haida by Hearing Disability
In terms of hearing disability, the demographic groups most similar to Tlingit-Haida are Inupiat (4.7%, a difference of 2.7%), Tsimshian (4.7%, a difference of 2.9%), Navajo (4.6%, a difference of 4.5%), Pueblo (4.6%, a difference of 4.9%), and Choctaw (4.5%, a difference of 6.4%).
| Demographics | Rating | Rank | Hearing Disability |
| Dutch West Indians | 0.0 /100 | #333 | Tragic 4.3% |
| Aleuts | 0.0 /100 | #334 | Tragic 4.3% |
| Kiowa | 0.0 /100 | #335 | Tragic 4.3% |
| Creek | 0.0 /100 | #336 | Tragic 4.4% |
| Chickasaw | 0.0 /100 | #337 | Tragic 4.5% |
| Alaska Natives | 0.0 /100 | #338 | Tragic 4.5% |
| Choctaw | 0.0 /100 | #339 | Tragic 4.5% |
| Pueblo | 0.0 /100 | #340 | Tragic 4.6% |
| Navajo | 0.0 /100 | #341 | Tragic 4.6% |
| Tsimshian | 0.0 /100 | #342 | Tragic 4.7% |
| Inupiat | 0.0 /100 | #343 | Tragic 4.7% |
| Tlingit-Haida | 0.0 /100 | #344 | Tragic 4.8% |
| Alaskan Athabascans | 0.0 /100 | #345 | Tragic 5.3% |
| Colville | 0.0 /100 | #346 | Tragic 5.3% |
| Yup'ik | 0.0 /100 | #347 | Tragic 5.8% |