Iranian vs Bangladeshi Hearing Disability
COMPARE
Iranian
Bangladeshi
Hearing Disability
Hearing Disability Comparison
Iranians
Bangladeshis
2.8%
HEARING DISABILITY
96.4/ 100
METRIC RATING
92nd/ 347
METRIC RANK
3.2%
HEARING DISABILITY
8.1/ 100
METRIC RATING
215th/ 347
METRIC RANK
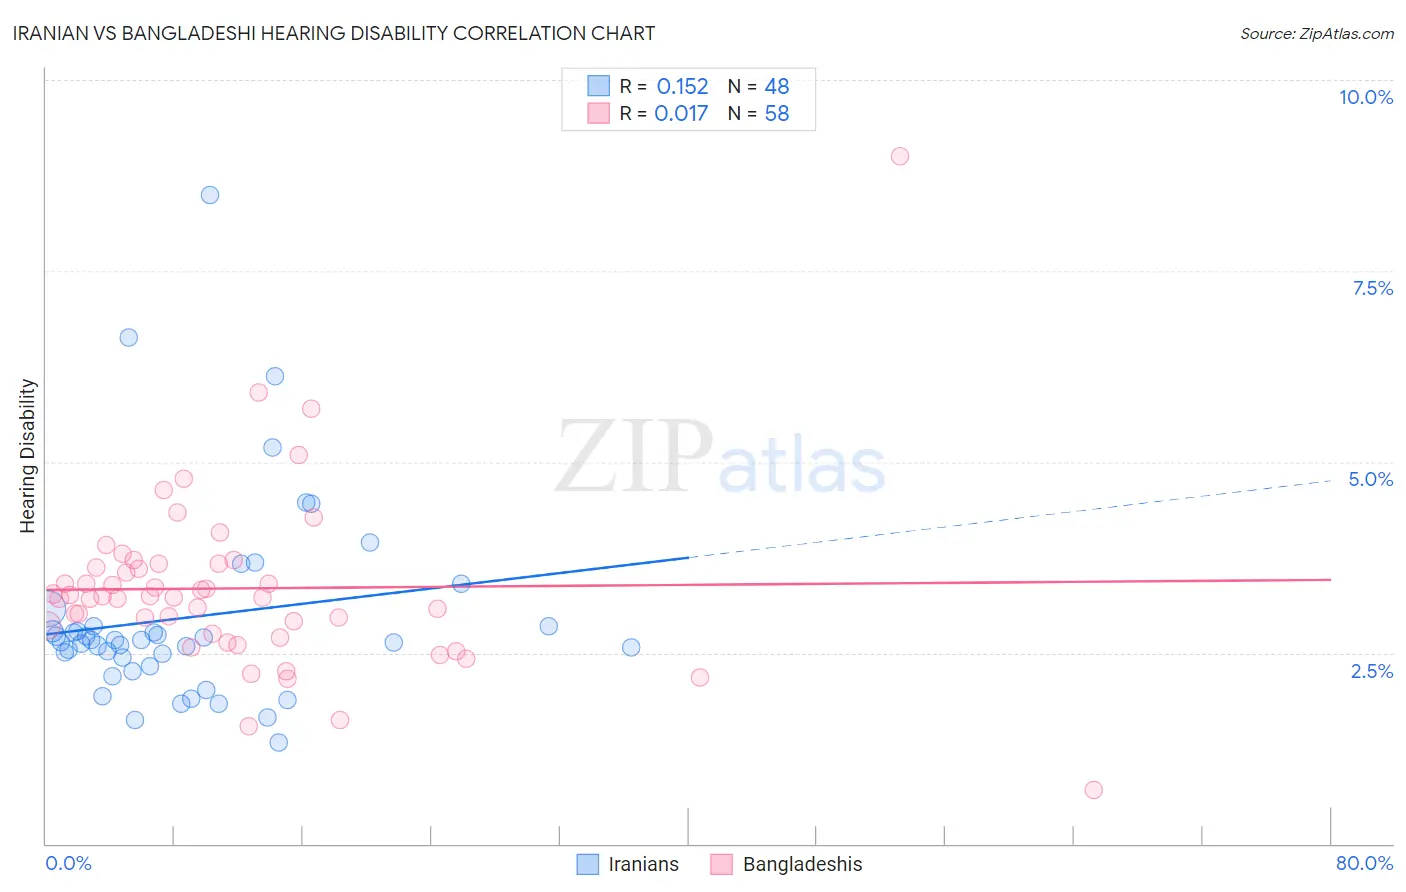
Iranian vs Bangladeshi Hearing Disability Correlation Chart
The statistical analysis conducted on geographies consisting of 316,808,830 people shows a poor positive correlation between the proportion of Iranians and percentage of population with hearing disability in the United States with a correlation coefficient (R) of 0.152 and weighted average of 2.8%. Similarly, the statistical analysis conducted on geographies consisting of 141,366,446 people shows no correlation between the proportion of Bangladeshis and percentage of population with hearing disability in the United States with a correlation coefficient (R) of 0.017 and weighted average of 3.2%, a difference of 14.6%.
Hearing Disability Correlation Summary
| Measurement | Iranian | Bangladeshi |
| Minimum | 1.3% | 0.71% |
| Maximum | 8.5% | 9.0% |
| Range | 7.2% | 8.3% |
| Mean | 3.0% | 3.3% |
| Median | 2.7% | 3.2% |
| Interquartile 25% (IQ1) | 2.4% | 2.8% |
| Interquartile 75% (IQ3) | 2.8% | 3.7% |
| Interquartile Range (IQR) | 0.46% | 0.90% |
| Standard Deviation (Sample) | 1.3% | 1.2% |
| Standard Deviation (Population) | 1.3% | 1.2% |
Similar Demographics by Hearing Disability
Demographics Similar to Iranians by Hearing Disability
In terms of hearing disability, the demographic groups most similar to Iranians are Immigrants from Middle Africa (2.8%, a difference of 0.030%), Immigrants from Morocco (2.8%, a difference of 0.11%), Immigrants from Kuwait (2.8%, a difference of 0.12%), Belizean (2.8%, a difference of 0.14%), and Immigrants from Turkey (2.8%, a difference of 0.17%).
| Demographics | Rating | Rank | Hearing Disability |
| Immigrants | Northern Africa | 96.9 /100 | #85 | Exceptional 2.8% |
| Immigrants | Iran | 96.8 /100 | #86 | Exceptional 2.8% |
| Somalis | 96.7 /100 | #87 | Exceptional 2.8% |
| Immigrants | Turkey | 96.7 /100 | #88 | Exceptional 2.8% |
| Belizeans | 96.6 /100 | #89 | Exceptional 2.8% |
| Immigrants | Morocco | 96.6 /100 | #90 | Exceptional 2.8% |
| Immigrants | Middle Africa | 96.5 /100 | #91 | Exceptional 2.8% |
| Iranians | 96.4 /100 | #92 | Exceptional 2.8% |
| Immigrants | Kuwait | 96.3 /100 | #93 | Exceptional 2.8% |
| Uruguayans | 95.9 /100 | #94 | Exceptional 2.8% |
| Israelis | 95.9 /100 | #95 | Exceptional 2.8% |
| Immigrants | Somalia | 95.5 /100 | #96 | Exceptional 2.8% |
| Immigrants | Afghanistan | 95.3 /100 | #97 | Exceptional 2.8% |
| Immigrants | Honduras | 95.1 /100 | #98 | Exceptional 2.8% |
| Immigrants | Guatemala | 95.1 /100 | #99 | Exceptional 2.8% |
Demographics Similar to Bangladeshis by Hearing Disability
In terms of hearing disability, the demographic groups most similar to Bangladeshis are Australian (3.2%, a difference of 0.010%), Immigrants from Norway (3.2%, a difference of 0.24%), Russian (3.2%, a difference of 0.32%), Immigrants from Northern Europe (3.2%, a difference of 0.35%), and New Zealander (3.2%, a difference of 0.41%).
| Demographics | Rating | Rank | Hearing Disability |
| Immigrants | Latvia | 12.7 /100 | #208 | Poor 3.1% |
| Immigrants | Hungary | 12.5 /100 | #209 | Poor 3.1% |
| Cape Verdeans | 12.2 /100 | #210 | Poor 3.1% |
| Romanians | 12.1 /100 | #211 | Poor 3.1% |
| Pakistanis | 11.1 /100 | #212 | Poor 3.1% |
| Immigrants | Iraq | 10.5 /100 | #213 | Poor 3.1% |
| Australians | 8.1 /100 | #214 | Tragic 3.2% |
| Bangladeshis | 8.1 /100 | #215 | Tragic 3.2% |
| Immigrants | Norway | 7.3 /100 | #216 | Tragic 3.2% |
| Russians | 7.1 /100 | #217 | Tragic 3.2% |
| Immigrants | Northern Europe | 7.0 /100 | #218 | Tragic 3.2% |
| New Zealanders | 6.8 /100 | #219 | Tragic 3.2% |
| Malaysians | 6.6 /100 | #220 | Tragic 3.2% |
| Immigrants | Laos | 6.6 /100 | #221 | Tragic 3.2% |
| Immigrants | Oceania | 6.5 /100 | #222 | Tragic 3.2% |