Iranian vs Egyptian Hearing Disability
COMPARE
Iranian
Egyptian
Hearing Disability
Hearing Disability Comparison
Iranians
Egyptians
2.8%
HEARING DISABILITY
96.4/ 100
METRIC RATING
92nd/ 347
METRIC RANK
2.7%
HEARING DISABILITY
98.1/ 100
METRIC RATING
67th/ 347
METRIC RANK
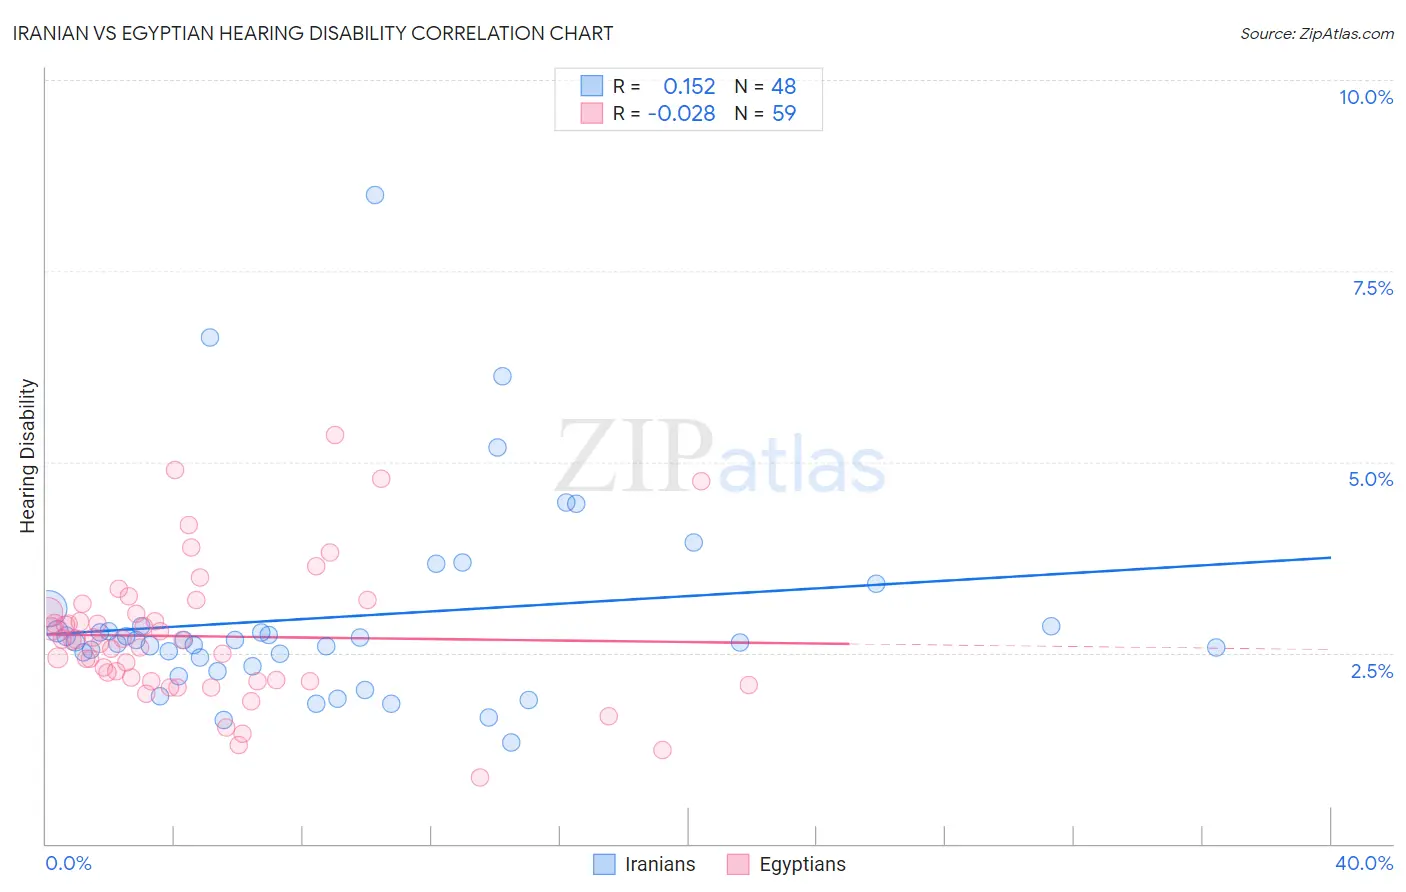
Iranian vs Egyptian Hearing Disability Correlation Chart
The statistical analysis conducted on geographies consisting of 316,808,830 people shows a poor positive correlation between the proportion of Iranians and percentage of population with hearing disability in the United States with a correlation coefficient (R) of 0.152 and weighted average of 2.8%. Similarly, the statistical analysis conducted on geographies consisting of 276,851,479 people shows no correlation between the proportion of Egyptians and percentage of population with hearing disability in the United States with a correlation coefficient (R) of -0.028 and weighted average of 2.7%, a difference of 1.6%.
Hearing Disability Correlation Summary
| Measurement | Iranian | Egyptian |
| Minimum | 1.3% | 0.86% |
| Maximum | 8.5% | 5.4% |
| Range | 7.2% | 4.5% |
| Mean | 3.0% | 2.7% |
| Median | 2.7% | 2.7% |
| Interquartile 25% (IQ1) | 2.4% | 2.1% |
| Interquartile 75% (IQ3) | 2.8% | 3.0% |
| Interquartile Range (IQR) | 0.46% | 0.90% |
| Standard Deviation (Sample) | 1.3% | 0.89% |
| Standard Deviation (Population) | 1.3% | 0.88% |
Similar Demographics by Hearing Disability
Demographics Similar to Iranians by Hearing Disability
In terms of hearing disability, the demographic groups most similar to Iranians are Immigrants from Middle Africa (2.8%, a difference of 0.030%), Immigrants from Morocco (2.8%, a difference of 0.11%), Immigrants from Kuwait (2.8%, a difference of 0.12%), Belizean (2.8%, a difference of 0.14%), and Immigrants from Turkey (2.8%, a difference of 0.17%).
| Demographics | Rating | Rank | Hearing Disability |
| Immigrants | Northern Africa | 96.9 /100 | #85 | Exceptional 2.8% |
| Immigrants | Iran | 96.8 /100 | #86 | Exceptional 2.8% |
| Somalis | 96.7 /100 | #87 | Exceptional 2.8% |
| Immigrants | Turkey | 96.7 /100 | #88 | Exceptional 2.8% |
| Belizeans | 96.6 /100 | #89 | Exceptional 2.8% |
| Immigrants | Morocco | 96.6 /100 | #90 | Exceptional 2.8% |
| Immigrants | Middle Africa | 96.5 /100 | #91 | Exceptional 2.8% |
| Iranians | 96.4 /100 | #92 | Exceptional 2.8% |
| Immigrants | Kuwait | 96.3 /100 | #93 | Exceptional 2.8% |
| Uruguayans | 95.9 /100 | #94 | Exceptional 2.8% |
| Israelis | 95.9 /100 | #95 | Exceptional 2.8% |
| Immigrants | Somalia | 95.5 /100 | #96 | Exceptional 2.8% |
| Immigrants | Afghanistan | 95.3 /100 | #97 | Exceptional 2.8% |
| Immigrants | Honduras | 95.1 /100 | #98 | Exceptional 2.8% |
| Immigrants | Guatemala | 95.1 /100 | #99 | Exceptional 2.8% |
Demographics Similar to Egyptians by Hearing Disability
In terms of hearing disability, the demographic groups most similar to Egyptians are Immigrants from Africa (2.7%, a difference of 0.13%), Nicaraguan (2.7%, a difference of 0.17%), Immigrants from Belize (2.7%, a difference of 0.23%), Immigrants from Nepal (2.7%, a difference of 0.35%), and Peruvian (2.7%, a difference of 0.40%).
| Demographics | Rating | Rank | Hearing Disability |
| Immigrants | Egypt | 98.5 /100 | #60 | Exceptional 2.7% |
| Immigrants | Uzbekistan | 98.4 /100 | #61 | Exceptional 2.7% |
| Immigrants | Colombia | 98.4 /100 | #62 | Exceptional 2.7% |
| Indians (Asian) | 98.4 /100 | #63 | Exceptional 2.7% |
| Immigrants | Sri Lanka | 98.4 /100 | #64 | Exceptional 2.7% |
| Immigrants | Nepal | 98.3 /100 | #65 | Exceptional 2.7% |
| Immigrants | Belize | 98.2 /100 | #66 | Exceptional 2.7% |
| Egyptians | 98.1 /100 | #67 | Exceptional 2.7% |
| Immigrants | Africa | 98.0 /100 | #68 | Exceptional 2.7% |
| Nicaraguans | 97.9 /100 | #69 | Exceptional 2.7% |
| Peruvians | 97.7 /100 | #70 | Exceptional 2.7% |
| Central Americans | 97.7 /100 | #71 | Exceptional 2.7% |
| Afghans | 97.6 /100 | #72 | Exceptional 2.7% |
| Argentineans | 97.5 /100 | #73 | Exceptional 2.7% |
| Immigrants | Korea | 97.5 /100 | #74 | Exceptional 2.7% |