Iranian vs Immigrants from Canada 10th Grade
COMPARE
Iranian
Immigrants from Canada
10th Grade
10th Grade Comparison
Iranians
Immigrants from Canada
95.3%
10TH GRADE
100.0/ 100
METRIC RATING
31st/ 347
METRIC RANK
95.1%
10TH GRADE
99.8/ 100
METRIC RATING
50th/ 347
METRIC RANK
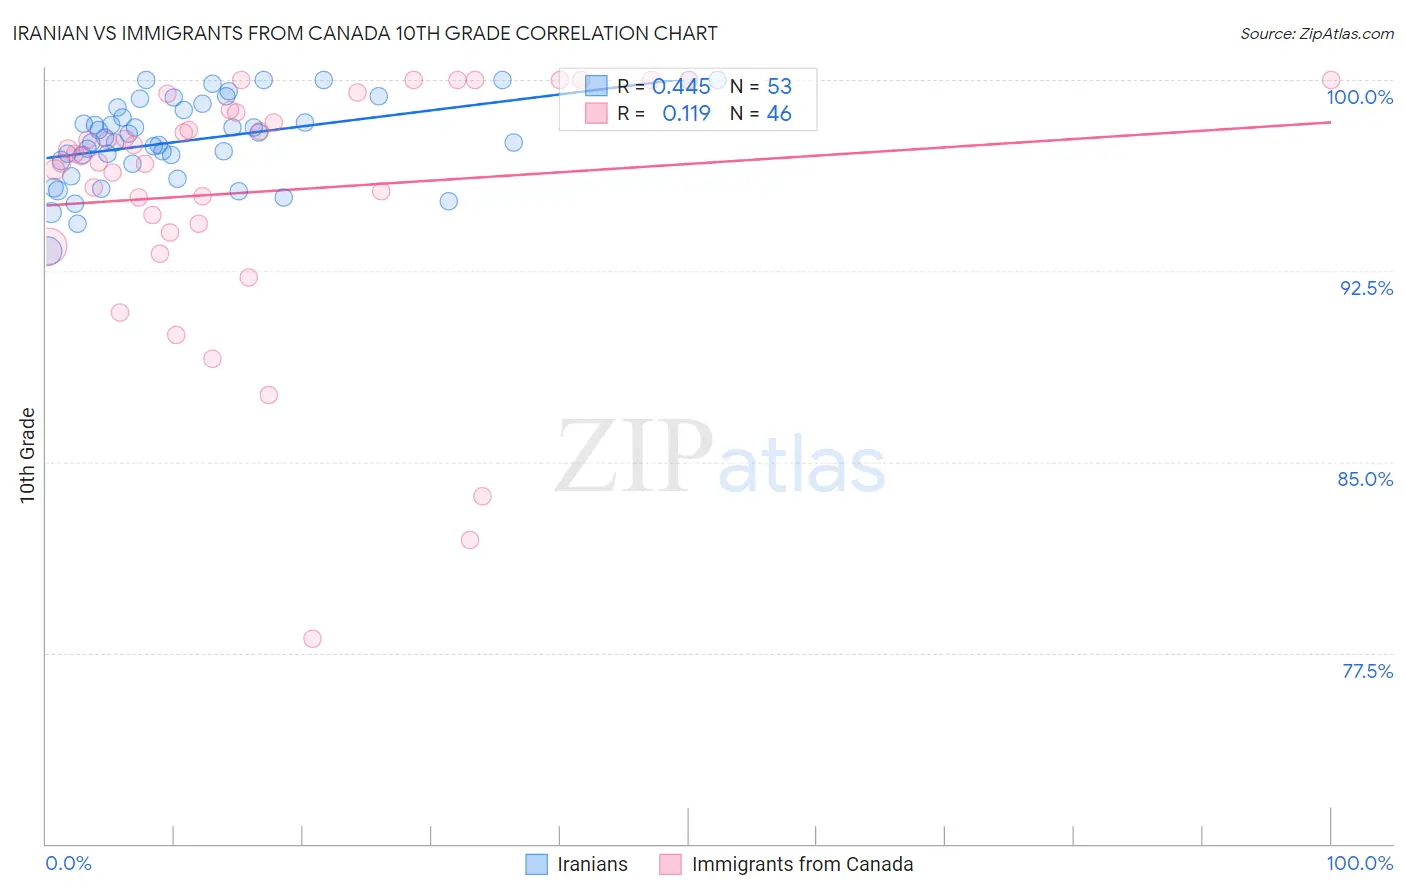
Iranian vs Immigrants from Canada 10th Grade Correlation Chart
The statistical analysis conducted on geographies consisting of 310,636,461 people shows a moderate positive correlation between the proportion of Iranians and percentage of population with at least 10th grade education in the United States with a correlation coefficient (R) of 0.445 and weighted average of 95.3%. Similarly, the statistical analysis conducted on geographies consisting of 459,397,383 people shows a poor positive correlation between the proportion of Immigrants from Canada and percentage of population with at least 10th grade education in the United States with a correlation coefficient (R) of 0.119 and weighted average of 95.1%, a difference of 0.28%.
10th Grade Correlation Summary
| Measurement | Iranian | Immigrants from Canada |
| Minimum | 93.3% | 78.1% |
| Maximum | 100.0% | 100.0% |
| Range | 6.7% | 21.9% |
| Mean | 97.7% | 95.6% |
| Median | 97.8% | 97.0% |
| Interquartile 25% (IQ1) | 96.8% | 94.4% |
| Interquartile 75% (IQ3) | 99.0% | 98.8% |
| Interquartile Range (IQR) | 2.2% | 4.5% |
| Standard Deviation (Sample) | 1.6% | 4.9% |
| Standard Deviation (Population) | 1.6% | 4.9% |
Demographics Similar to Iranians and Immigrants from Canada by 10th Grade
In terms of 10th grade, the demographic groups most similar to Iranians are Hungarian (95.3%, a difference of 0.0%), French (95.3%, a difference of 0.0%), British (95.3%, a difference of 0.010%), Belgian (95.4%, a difference of 0.020%), and Estonian (95.3%, a difference of 0.020%). Similarly, the demographic groups most similar to Immigrants from Canada are Immigrants from Austria (95.1%, a difference of 0.030%), Australian (95.1%, a difference of 0.060%), Serbian (95.1%, a difference of 0.070%), Czechoslovakian (95.1%, a difference of 0.080%), and Immigrants from Northern Europe (95.2%, a difference of 0.090%).
| Demographics | Rating | Rank | 10th Grade |
| Belgians | 100.0 /100 | #30 | Exceptional 95.4% |
| Iranians | 100.0 /100 | #31 | Exceptional 95.3% |
| Hungarians | 100.0 /100 | #32 | Exceptional 95.3% |
| French | 100.0 /100 | #33 | Exceptional 95.3% |
| British | 99.9 /100 | #34 | Exceptional 95.3% |
| Estonians | 99.9 /100 | #35 | Exceptional 95.3% |
| Immigrants | India | 99.9 /100 | #36 | Exceptional 95.3% |
| French Canadians | 99.9 /100 | #37 | Exceptional 95.3% |
| Northern Europeans | 99.9 /100 | #38 | Exceptional 95.3% |
| Immigrants | Scotland | 99.9 /100 | #39 | Exceptional 95.2% |
| Scotch-Irish | 99.9 /100 | #40 | Exceptional 95.2% |
| Russians | 99.9 /100 | #41 | Exceptional 95.2% |
| Slavs | 99.9 /100 | #42 | Exceptional 95.2% |
| Macedonians | 99.9 /100 | #43 | Exceptional 95.2% |
| Immigrants | Northern Europe | 99.9 /100 | #44 | Exceptional 95.2% |
| Greeks | 99.9 /100 | #45 | Exceptional 95.2% |
| Czechoslovakians | 99.9 /100 | #46 | Exceptional 95.1% |
| Serbians | 99.9 /100 | #47 | Exceptional 95.1% |
| Australians | 99.9 /100 | #48 | Exceptional 95.1% |
| Immigrants | Austria | 99.9 /100 | #49 | Exceptional 95.1% |
| Immigrants | Canada | 99.8 /100 | #50 | Exceptional 95.1% |