Immigrants from Egypt vs Scottish Disability
COMPARE
Immigrants from Egypt
Scottish
Disability
Disability Comparison
Immigrants from Egypt
Scottish
10.6%
DISABILITY
100.0/ 100
METRIC RATING
31st/ 347
METRIC RANK
12.9%
DISABILITY
0.0/ 100
METRIC RATING
282nd/ 347
METRIC RANK
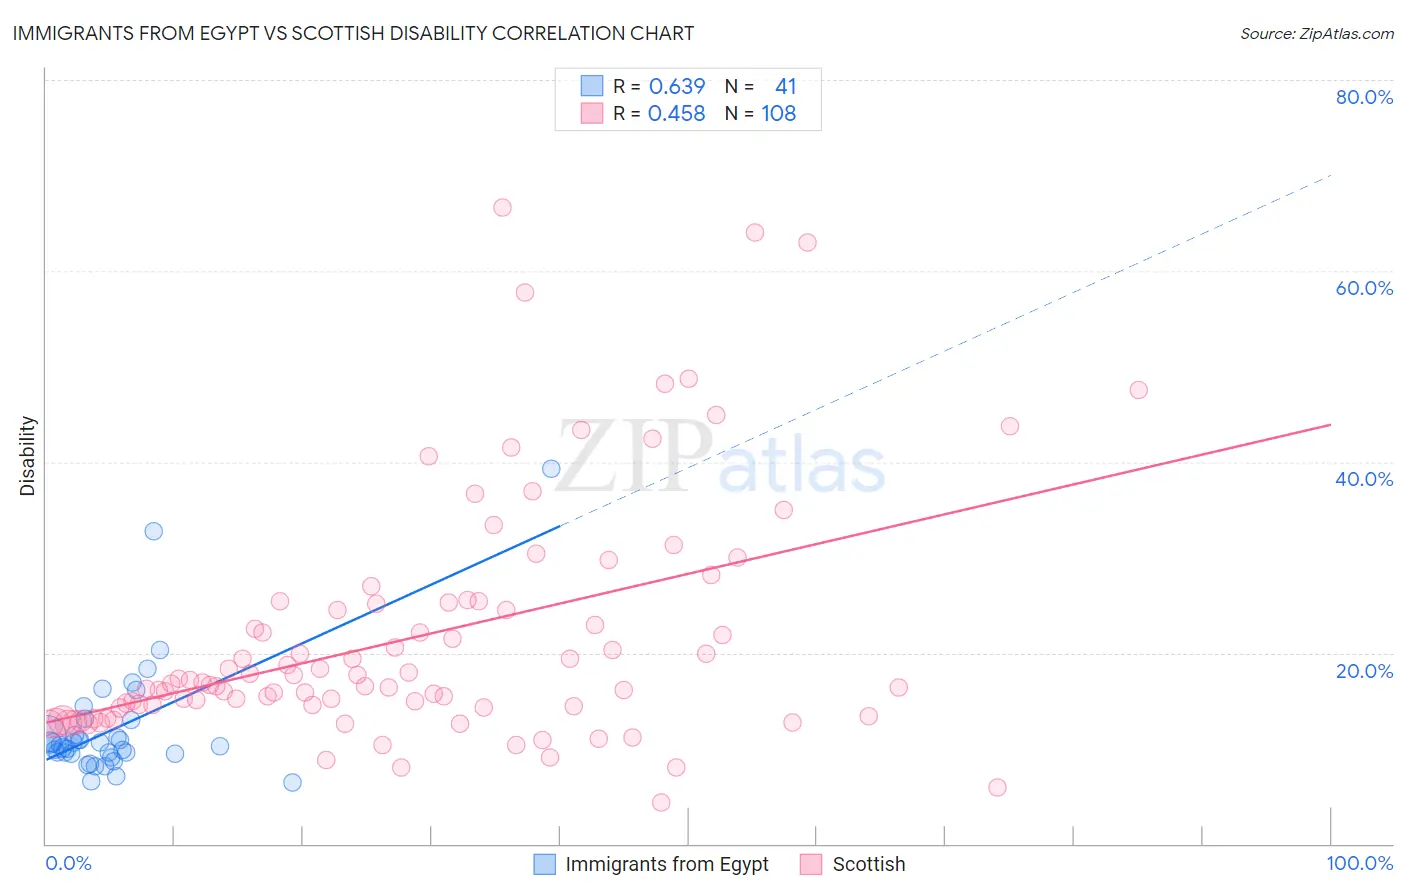
Immigrants from Egypt vs Scottish Disability Correlation Chart
The statistical analysis conducted on geographies consisting of 245,492,432 people shows a significant positive correlation between the proportion of Immigrants from Egypt and percentage of population with a disability in the United States with a correlation coefficient (R) of 0.639 and weighted average of 10.6%. Similarly, the statistical analysis conducted on geographies consisting of 567,015,833 people shows a moderate positive correlation between the proportion of Scottish and percentage of population with a disability in the United States with a correlation coefficient (R) of 0.458 and weighted average of 12.9%, a difference of 21.1%.
Disability Correlation Summary
| Measurement | Immigrants from Egypt | Scottish |
| Minimum | 6.4% | 4.3% |
| Maximum | 39.3% | 66.7% |
| Range | 32.9% | 62.3% |
| Mean | 12.1% | 21.6% |
| Median | 10.4% | 16.7% |
| Interquartile 25% (IQ1) | 9.4% | 14.2% |
| Interquartile 75% (IQ3) | 12.2% | 25.2% |
| Interquartile Range (IQR) | 2.8% | 11.0% |
| Standard Deviation (Sample) | 6.3% | 12.7% |
| Standard Deviation (Population) | 6.2% | 12.6% |
Similar Demographics by Disability
Demographics Similar to Immigrants from Egypt by Disability
In terms of disability, the demographic groups most similar to Immigrants from Egypt are Immigrants from Turkey (10.6%, a difference of 0.070%), Paraguayan (10.6%, a difference of 0.10%), Immigrants from Argentina (10.6%, a difference of 0.23%), Egyptian (10.6%, a difference of 0.35%), and Immigrants from Kuwait (10.7%, a difference of 0.35%).
| Demographics | Rating | Rank | Disability |
| Venezuelans | 100.0 /100 | #24 | Exceptional 10.5% |
| Immigrants | Malaysia | 100.0 /100 | #25 | Exceptional 10.6% |
| Argentineans | 100.0 /100 | #26 | Exceptional 10.6% |
| Cypriots | 100.0 /100 | #27 | Exceptional 10.6% |
| Egyptians | 100.0 /100 | #28 | Exceptional 10.6% |
| Immigrants | Argentina | 100.0 /100 | #29 | Exceptional 10.6% |
| Immigrants | Turkey | 100.0 /100 | #30 | Exceptional 10.6% |
| Immigrants | Egypt | 100.0 /100 | #31 | Exceptional 10.6% |
| Paraguayans | 100.0 /100 | #32 | Exceptional 10.6% |
| Immigrants | Kuwait | 100.0 /100 | #33 | Exceptional 10.7% |
| Immigrants | Ethiopia | 100.0 /100 | #34 | Exceptional 10.7% |
| Immigrants | Indonesia | 100.0 /100 | #35 | Exceptional 10.7% |
| Ethiopians | 100.0 /100 | #36 | Exceptional 10.7% |
| Turks | 100.0 /100 | #37 | Exceptional 10.7% |
| Afghans | 99.9 /100 | #38 | Exceptional 10.8% |
Demographics Similar to Scottish by Disability
In terms of disability, the demographic groups most similar to Scottish are Irish (12.9%, a difference of 0.020%), Immigrants from Portugal (12.9%, a difference of 0.14%), Welsh (12.9%, a difference of 0.22%), Crow (12.9%, a difference of 0.22%), and Spanish (12.8%, a difference of 0.28%).
| Demographics | Rating | Rank | Disability |
| Sioux | 0.0 /100 | #275 | Tragic 12.8% |
| Hmong | 0.0 /100 | #276 | Tragic 12.8% |
| Dutch | 0.0 /100 | #277 | Tragic 12.8% |
| Germans | 0.0 /100 | #278 | Tragic 12.8% |
| Fijians | 0.0 /100 | #279 | Tragic 12.8% |
| Spanish | 0.0 /100 | #280 | Tragic 12.8% |
| Immigrants | Portugal | 0.0 /100 | #281 | Tragic 12.9% |
| Scottish | 0.0 /100 | #282 | Tragic 12.9% |
| Irish | 0.0 /100 | #283 | Tragic 12.9% |
| Welsh | 0.0 /100 | #284 | Tragic 12.9% |
| Crow | 0.0 /100 | #285 | Tragic 12.9% |
| English | 0.0 /100 | #286 | Tragic 13.0% |
| Africans | 0.0 /100 | #287 | Tragic 13.0% |
| Whites/Caucasians | 0.0 /100 | #288 | Tragic 13.0% |
| Slovaks | 0.0 /100 | #289 | Tragic 13.0% |