Immigrants vs Immigrants from Philippines Vision Disability
COMPARE
Immigrants
Immigrants from Philippines
Vision Disability
Vision Disability Comparison
Immigrants
Immigrants from Philippines
2.2%
VISION DISABILITY
23.7/ 100
METRIC RATING
195th/ 347
METRIC RANK
2.1%
VISION DISABILITY
91.4/ 100
METRIC RATING
118th/ 347
METRIC RANK
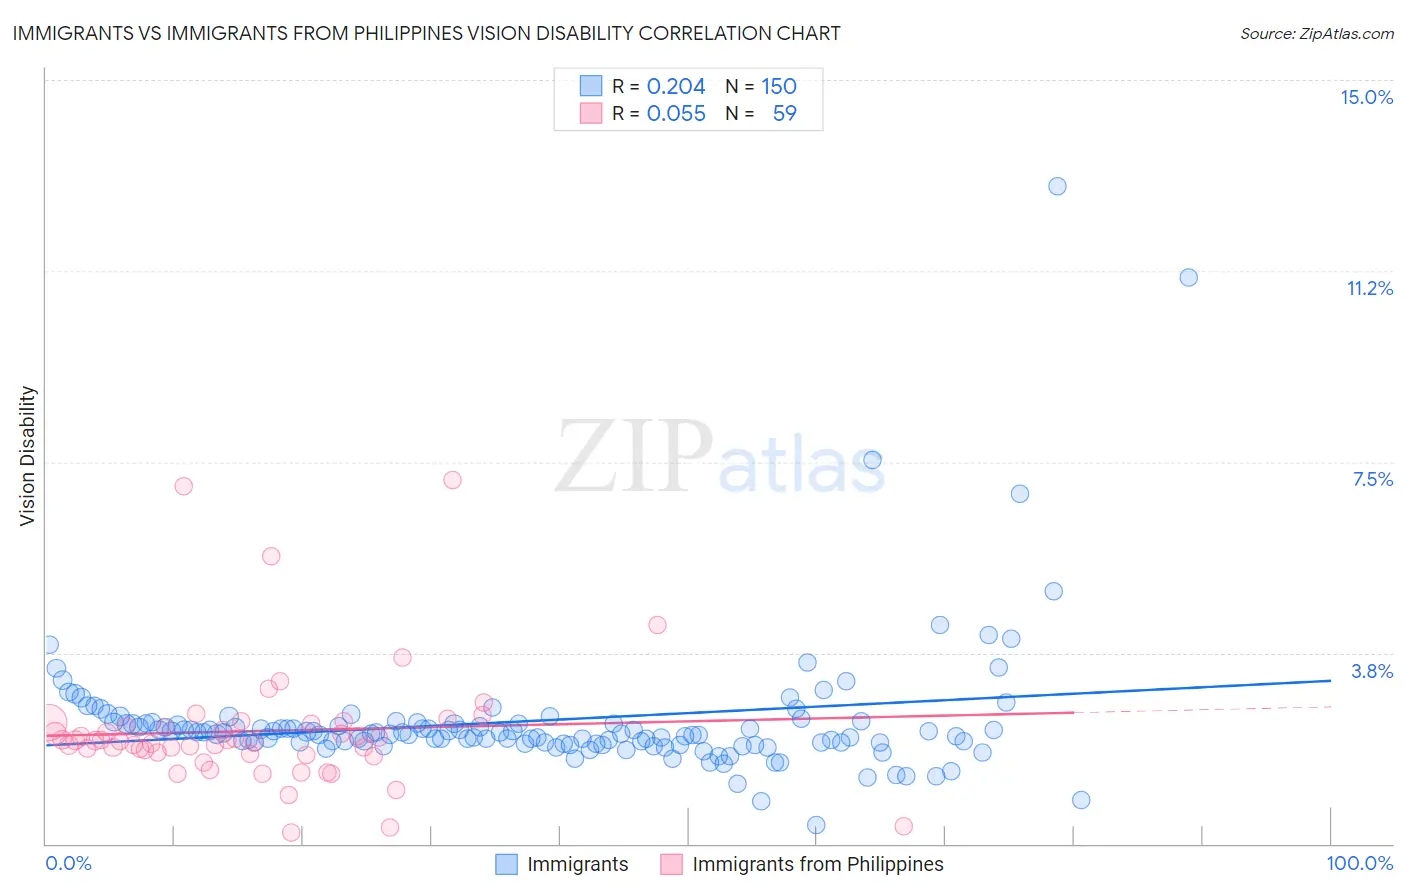
Immigrants vs Immigrants from Philippines Vision Disability Correlation Chart
The statistical analysis conducted on geographies consisting of 575,432,160 people shows a weak positive correlation between the proportion of Immigrants and percentage of population with vision disability in the United States with a correlation coefficient (R) of 0.204 and weighted average of 2.2%. Similarly, the statistical analysis conducted on geographies consisting of 470,744,203 people shows a slight positive correlation between the proportion of Immigrants from Philippines and percentage of population with vision disability in the United States with a correlation coefficient (R) of 0.055 and weighted average of 2.1%, a difference of 5.8%.
Vision Disability Correlation Summary
| Measurement | Immigrants | Immigrants from Philippines |
| Minimum | 0.37% | 0.22% |
| Maximum | 12.9% | 7.1% |
| Range | 12.5% | 6.9% |
| Mean | 2.4% | 2.2% |
| Median | 2.2% | 2.0% |
| Interquartile 25% (IQ1) | 2.0% | 1.8% |
| Interquartile 75% (IQ3) | 2.4% | 2.4% |
| Interquartile Range (IQR) | 0.38% | 0.59% |
| Standard Deviation (Sample) | 1.4% | 1.2% |
| Standard Deviation (Population) | 1.4% | 1.2% |
Similar Demographics by Vision Disability
Demographics Similar to Immigrants by Vision Disability
In terms of vision disability, the demographic groups most similar to Immigrants are Immigrants from Barbados (2.2%, a difference of 0.020%), Immigrants from Grenada (2.2%, a difference of 0.050%), British (2.2%, a difference of 0.11%), Canadian (2.2%, a difference of 0.17%), and European (2.2%, a difference of 0.17%).
| Demographics | Rating | Rank | Vision Disability |
| Guyanese | 28.9 /100 | #188 | Fair 2.2% |
| Salvadorans | 27.4 /100 | #189 | Fair 2.2% |
| Immigrants | Costa Rica | 26.1 /100 | #190 | Fair 2.2% |
| Canadians | 25.8 /100 | #191 | Fair 2.2% |
| Europeans | 25.7 /100 | #192 | Fair 2.2% |
| British | 25.1 /100 | #193 | Fair 2.2% |
| Immigrants | Barbados | 24.0 /100 | #194 | Fair 2.2% |
| Immigrants | Immigrants | 23.7 /100 | #195 | Fair 2.2% |
| Immigrants | Grenada | 23.1 /100 | #196 | Fair 2.2% |
| Ghanaians | 21.8 /100 | #197 | Fair 2.2% |
| Czechoslovakians | 21.6 /100 | #198 | Fair 2.2% |
| Immigrants | El Salvador | 21.0 /100 | #199 | Fair 2.2% |
| Immigrants | Thailand | 20.1 /100 | #200 | Fair 2.2% |
| Slovaks | 18.8 /100 | #201 | Poor 2.2% |
| Immigrants | Zaire | 18.0 /100 | #202 | Poor 2.2% |
Demographics Similar to Immigrants from Philippines by Vision Disability
In terms of vision disability, the demographic groups most similar to Immigrants from Philippines are Immigrants from Uganda (2.1%, a difference of 0.0%), Immigrants from Zimbabwe (2.1%, a difference of 0.070%), Polish (2.1%, a difference of 0.13%), Immigrants from Vietnam (2.1%, a difference of 0.18%), and Ugandan (2.1%, a difference of 0.18%).
| Demographics | Rating | Rank | Vision Disability |
| Peruvians | 93.5 /100 | #111 | Exceptional 2.1% |
| Immigrants | Denmark | 92.9 /100 | #112 | Exceptional 2.1% |
| Kenyans | 92.5 /100 | #113 | Exceptional 2.1% |
| Croatians | 92.3 /100 | #114 | Exceptional 2.1% |
| Immigrants | Vietnam | 92.2 /100 | #115 | Exceptional 2.1% |
| Ugandans | 92.2 /100 | #116 | Exceptional 2.1% |
| Poles | 92.0 /100 | #117 | Exceptional 2.1% |
| Immigrants | Philippines | 91.4 /100 | #118 | Exceptional 2.1% |
| Immigrants | Uganda | 91.4 /100 | #119 | Exceptional 2.1% |
| Immigrants | Zimbabwe | 91.0 /100 | #120 | Exceptional 2.1% |
| Immigrants | Scotland | 90.4 /100 | #121 | Exceptional 2.1% |
| Immigrants | Ukraine | 90.4 /100 | #122 | Exceptional 2.1% |
| Immigrants | Albania | 90.4 /100 | #123 | Exceptional 2.1% |
| Immigrants | Spain | 89.8 /100 | #124 | Excellent 2.1% |
| Immigrants | Venezuela | 89.8 /100 | #125 | Excellent 2.1% |