Immigrants vs Immigrants from Croatia Vision Disability
COMPARE
Immigrants
Immigrants from Croatia
Vision Disability
Vision Disability Comparison
Immigrants
Immigrants from Croatia
2.2%
VISION DISABILITY
23.7/ 100
METRIC RATING
195th/ 347
METRIC RANK
2.1%
VISION DISABILITY
96.0/ 100
METRIC RATING
94th/ 347
METRIC RANK
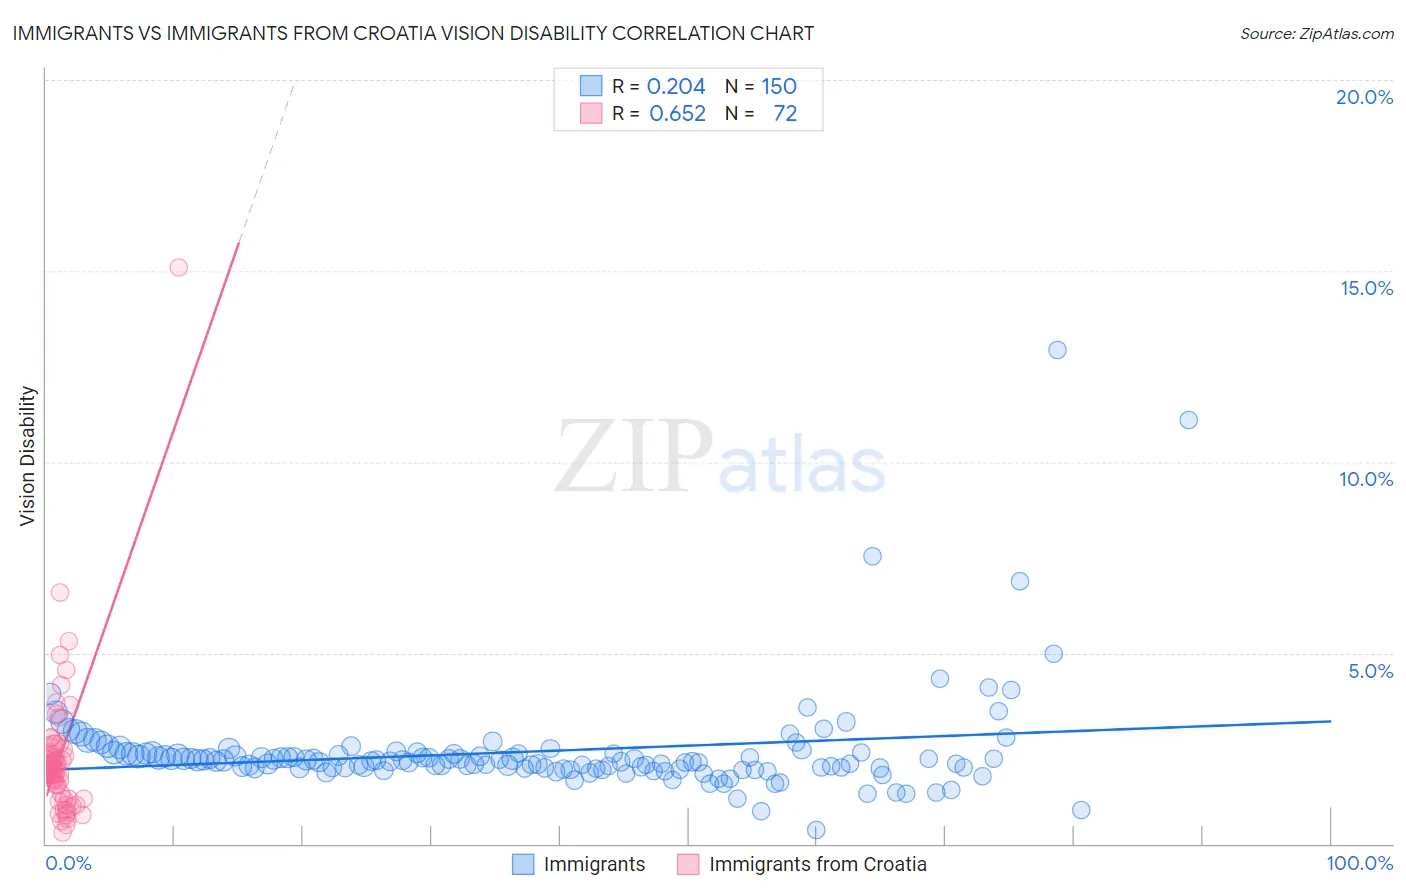
Immigrants vs Immigrants from Croatia Vision Disability Correlation Chart
The statistical analysis conducted on geographies consisting of 575,432,160 people shows a weak positive correlation between the proportion of Immigrants and percentage of population with vision disability in the United States with a correlation coefficient (R) of 0.204 and weighted average of 2.2%. Similarly, the statistical analysis conducted on geographies consisting of 132,552,000 people shows a significant positive correlation between the proportion of Immigrants from Croatia and percentage of population with vision disability in the United States with a correlation coefficient (R) of 0.652 and weighted average of 2.1%, a difference of 7.2%.
Vision Disability Correlation Summary
| Measurement | Immigrants | Immigrants from Croatia |
| Minimum | 0.37% | 0.31% |
| Maximum | 12.9% | 15.1% |
| Range | 12.5% | 14.8% |
| Mean | 2.4% | 2.2% |
| Median | 2.2% | 1.9% |
| Interquartile 25% (IQ1) | 2.0% | 1.4% |
| Interquartile 75% (IQ3) | 2.4% | 2.3% |
| Interquartile Range (IQR) | 0.38% | 0.91% |
| Standard Deviation (Sample) | 1.4% | 1.9% |
| Standard Deviation (Population) | 1.4% | 1.9% |
Similar Demographics by Vision Disability
Demographics Similar to Immigrants by Vision Disability
In terms of vision disability, the demographic groups most similar to Immigrants are Immigrants from Barbados (2.2%, a difference of 0.020%), Immigrants from Grenada (2.2%, a difference of 0.050%), British (2.2%, a difference of 0.11%), Canadian (2.2%, a difference of 0.17%), and European (2.2%, a difference of 0.17%).
| Demographics | Rating | Rank | Vision Disability |
| Guyanese | 28.9 /100 | #188 | Fair 2.2% |
| Salvadorans | 27.4 /100 | #189 | Fair 2.2% |
| Immigrants | Costa Rica | 26.1 /100 | #190 | Fair 2.2% |
| Canadians | 25.8 /100 | #191 | Fair 2.2% |
| Europeans | 25.7 /100 | #192 | Fair 2.2% |
| British | 25.1 /100 | #193 | Fair 2.2% |
| Immigrants | Barbados | 24.0 /100 | #194 | Fair 2.2% |
| Immigrants | Immigrants | 23.7 /100 | #195 | Fair 2.2% |
| Immigrants | Grenada | 23.1 /100 | #196 | Fair 2.2% |
| Ghanaians | 21.8 /100 | #197 | Fair 2.2% |
| Czechoslovakians | 21.6 /100 | #198 | Fair 2.2% |
| Immigrants | El Salvador | 21.0 /100 | #199 | Fair 2.2% |
| Immigrants | Thailand | 20.1 /100 | #200 | Fair 2.2% |
| Slovaks | 18.8 /100 | #201 | Poor 2.2% |
| Immigrants | Zaire | 18.0 /100 | #202 | Poor 2.2% |
Demographics Similar to Immigrants from Croatia by Vision Disability
In terms of vision disability, the demographic groups most similar to Immigrants from Croatia are Immigrants from Europe (2.1%, a difference of 0.020%), Immigrants from Syria (2.1%, a difference of 0.070%), Australian (2.1%, a difference of 0.070%), Immigrants from Somalia (2.1%, a difference of 0.090%), and Romanian (2.1%, a difference of 0.13%).
| Demographics | Rating | Rank | Vision Disability |
| Immigrants | Switzerland | 97.0 /100 | #87 | Exceptional 2.0% |
| Norwegians | 97.0 /100 | #88 | Exceptional 2.0% |
| Immigrants | Eastern Africa | 97.0 /100 | #89 | Exceptional 2.0% |
| Immigrants | Lebanon | 96.7 /100 | #90 | Exceptional 2.1% |
| Immigrants | Somalia | 96.2 /100 | #91 | Exceptional 2.1% |
| Immigrants | Syria | 96.2 /100 | #92 | Exceptional 2.1% |
| Immigrants | Europe | 96.1 /100 | #93 | Exceptional 2.1% |
| Immigrants | Croatia | 96.0 /100 | #94 | Exceptional 2.1% |
| Australians | 95.9 /100 | #95 | Exceptional 2.1% |
| Romanians | 95.7 /100 | #96 | Exceptional 2.1% |
| Immigrants | Afghanistan | 95.6 /100 | #97 | Exceptional 2.1% |
| Immigrants | South Africa | 95.4 /100 | #98 | Exceptional 2.1% |
| Estonians | 95.3 /100 | #99 | Exceptional 2.1% |
| Greeks | 95.1 /100 | #100 | Exceptional 2.1% |
| Albanians | 94.9 /100 | #101 | Exceptional 2.1% |