Immigrants vs Basque Vision Disability
COMPARE
Immigrants
Basque
Vision Disability
Vision Disability Comparison
Immigrants
Basques
2.2%
VISION DISABILITY
23.7/ 100
METRIC RATING
195th/ 347
METRIC RANK
2.3%
VISION DISABILITY
3.5/ 100
METRIC RATING
223rd/ 347
METRIC RANK
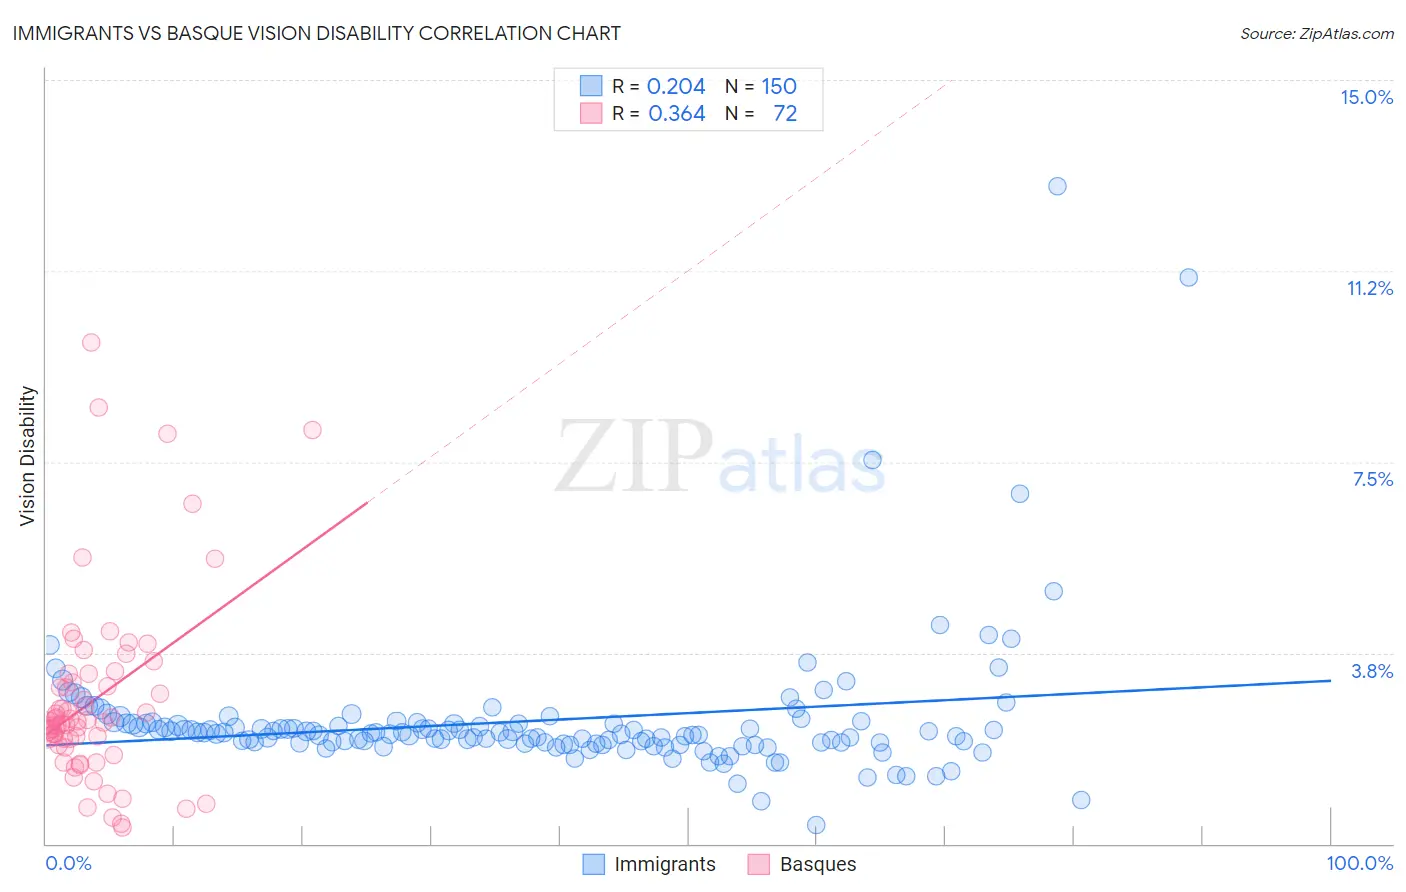
Immigrants vs Basque Vision Disability Correlation Chart
The statistical analysis conducted on geographies consisting of 575,432,160 people shows a weak positive correlation between the proportion of Immigrants and percentage of population with vision disability in the United States with a correlation coefficient (R) of 0.204 and weighted average of 2.2%. Similarly, the statistical analysis conducted on geographies consisting of 165,747,167 people shows a mild positive correlation between the proportion of Basques and percentage of population with vision disability in the United States with a correlation coefficient (R) of 0.364 and weighted average of 2.3%, a difference of 3.3%.
Vision Disability Correlation Summary
| Measurement | Immigrants | Basque |
| Minimum | 0.37% | 0.32% |
| Maximum | 12.9% | 9.8% |
| Range | 12.5% | 9.5% |
| Mean | 2.4% | 2.8% |
| Median | 2.2% | 2.4% |
| Interquartile 25% (IQ1) | 2.0% | 2.0% |
| Interquartile 75% (IQ3) | 2.4% | 3.2% |
| Interquartile Range (IQR) | 0.38% | 1.3% |
| Standard Deviation (Sample) | 1.4% | 1.8% |
| Standard Deviation (Population) | 1.4% | 1.8% |
Similar Demographics by Vision Disability
Demographics Similar to Immigrants by Vision Disability
In terms of vision disability, the demographic groups most similar to Immigrants are Immigrants from Barbados (2.2%, a difference of 0.020%), Immigrants from Grenada (2.2%, a difference of 0.050%), British (2.2%, a difference of 0.11%), Canadian (2.2%, a difference of 0.17%), and European (2.2%, a difference of 0.17%).
| Demographics | Rating | Rank | Vision Disability |
| Guyanese | 28.9 /100 | #188 | Fair 2.2% |
| Salvadorans | 27.4 /100 | #189 | Fair 2.2% |
| Immigrants | Costa Rica | 26.1 /100 | #190 | Fair 2.2% |
| Canadians | 25.8 /100 | #191 | Fair 2.2% |
| Europeans | 25.7 /100 | #192 | Fair 2.2% |
| British | 25.1 /100 | #193 | Fair 2.2% |
| Immigrants | Barbados | 24.0 /100 | #194 | Fair 2.2% |
| Immigrants | Immigrants | 23.7 /100 | #195 | Fair 2.2% |
| Immigrants | Grenada | 23.1 /100 | #196 | Fair 2.2% |
| Ghanaians | 21.8 /100 | #197 | Fair 2.2% |
| Czechoslovakians | 21.6 /100 | #198 | Fair 2.2% |
| Immigrants | El Salvador | 21.0 /100 | #199 | Fair 2.2% |
| Immigrants | Thailand | 20.1 /100 | #200 | Fair 2.2% |
| Slovaks | 18.8 /100 | #201 | Poor 2.2% |
| Immigrants | Zaire | 18.0 /100 | #202 | Poor 2.2% |
Demographics Similar to Basques by Vision Disability
In terms of vision disability, the demographic groups most similar to Basques are Irish (2.3%, a difference of 0.020%), Immigrants from Western Africa (2.3%, a difference of 0.040%), Immigrants from Senegal (2.3%, a difference of 0.14%), French Canadian (2.3%, a difference of 0.16%), and Guamanian/Chamorro (2.3%, a difference of 0.18%).
| Demographics | Rating | Rank | Vision Disability |
| Immigrants | Trinidad and Tobago | 6.1 /100 | #216 | Tragic 2.3% |
| Barbadians | 5.1 /100 | #217 | Tragic 2.3% |
| Portuguese | 4.9 /100 | #218 | Tragic 2.3% |
| Ecuadorians | 4.6 /100 | #219 | Tragic 2.3% |
| Guamanians/Chamorros | 3.9 /100 | #220 | Tragic 2.3% |
| French Canadians | 3.9 /100 | #221 | Tragic 2.3% |
| Immigrants | Senegal | 3.8 /100 | #222 | Tragic 2.3% |
| Basques | 3.5 /100 | #223 | Tragic 2.3% |
| Irish | 3.4 /100 | #224 | Tragic 2.3% |
| Immigrants | Western Africa | 3.4 /100 | #225 | Tragic 2.3% |
| Immigrants | Germany | 3.0 /100 | #226 | Tragic 2.3% |
| Hawaiians | 2.9 /100 | #227 | Tragic 2.3% |
| Hmong | 2.5 /100 | #228 | Tragic 2.3% |
| Welsh | 2.3 /100 | #229 | Tragic 2.3% |
| Nicaraguans | 2.2 /100 | #230 | Tragic 2.3% |