Immigrants vs Immigrants from Eastern Europe Vision Disability
COMPARE
Immigrants
Immigrants from Eastern Europe
Vision Disability
Vision Disability Comparison
Immigrants
Immigrants from Eastern Europe
2.2%
VISION DISABILITY
23.7/ 100
METRIC RATING
195th/ 347
METRIC RANK
2.0%
VISION DISABILITY
98.3/ 100
METRIC RATING
78th/ 347
METRIC RANK
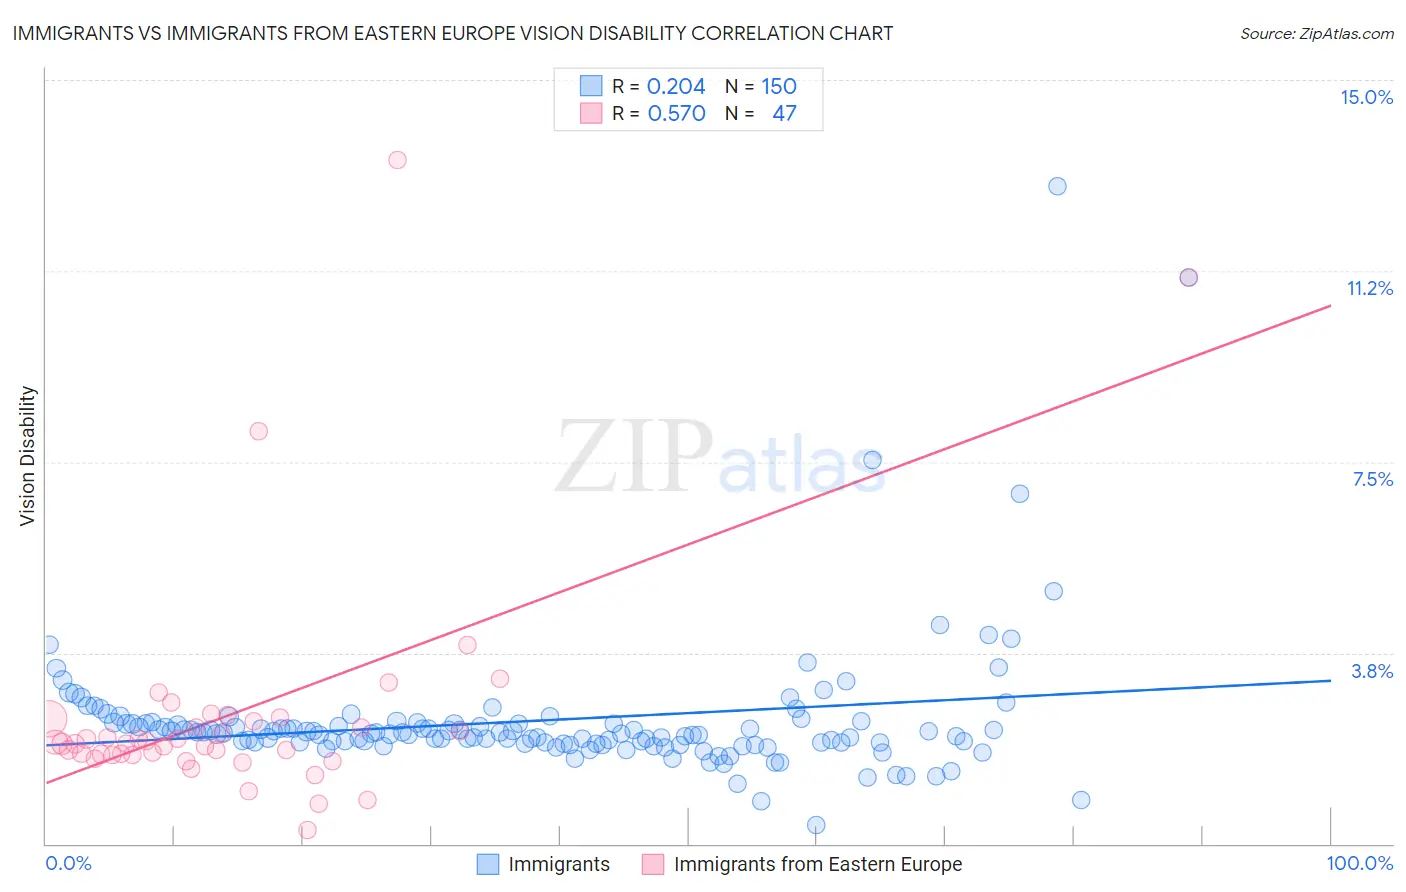
Immigrants vs Immigrants from Eastern Europe Vision Disability Correlation Chart
The statistical analysis conducted on geographies consisting of 575,432,160 people shows a weak positive correlation between the proportion of Immigrants and percentage of population with vision disability in the United States with a correlation coefficient (R) of 0.204 and weighted average of 2.2%. Similarly, the statistical analysis conducted on geographies consisting of 475,183,449 people shows a substantial positive correlation between the proportion of Immigrants from Eastern Europe and percentage of population with vision disability in the United States with a correlation coefficient (R) of 0.570 and weighted average of 2.0%, a difference of 8.7%.
Vision Disability Correlation Summary
| Measurement | Immigrants | Immigrants from Eastern Europe |
| Minimum | 0.37% | 0.27% |
| Maximum | 12.9% | 13.4% |
| Range | 12.5% | 13.2% |
| Mean | 2.4% | 2.6% |
| Median | 2.2% | 2.0% |
| Interquartile 25% (IQ1) | 2.0% | 1.8% |
| Interquartile 75% (IQ3) | 2.4% | 2.4% |
| Interquartile Range (IQR) | 0.38% | 0.70% |
| Standard Deviation (Sample) | 1.4% | 2.3% |
| Standard Deviation (Population) | 1.4% | 2.3% |
Similar Demographics by Vision Disability
Demographics Similar to Immigrants by Vision Disability
In terms of vision disability, the demographic groups most similar to Immigrants are Immigrants from Barbados (2.2%, a difference of 0.020%), Immigrants from Grenada (2.2%, a difference of 0.050%), British (2.2%, a difference of 0.11%), Canadian (2.2%, a difference of 0.17%), and European (2.2%, a difference of 0.17%).
| Demographics | Rating | Rank | Vision Disability |
| Guyanese | 28.9 /100 | #188 | Fair 2.2% |
| Salvadorans | 27.4 /100 | #189 | Fair 2.2% |
| Immigrants | Costa Rica | 26.1 /100 | #190 | Fair 2.2% |
| Canadians | 25.8 /100 | #191 | Fair 2.2% |
| Europeans | 25.7 /100 | #192 | Fair 2.2% |
| British | 25.1 /100 | #193 | Fair 2.2% |
| Immigrants | Barbados | 24.0 /100 | #194 | Fair 2.2% |
| Immigrants | Immigrants | 23.7 /100 | #195 | Fair 2.2% |
| Immigrants | Grenada | 23.1 /100 | #196 | Fair 2.2% |
| Ghanaians | 21.8 /100 | #197 | Fair 2.2% |
| Czechoslovakians | 21.6 /100 | #198 | Fair 2.2% |
| Immigrants | El Salvador | 21.0 /100 | #199 | Fair 2.2% |
| Immigrants | Thailand | 20.1 /100 | #200 | Fair 2.2% |
| Slovaks | 18.8 /100 | #201 | Poor 2.2% |
| Immigrants | Zaire | 18.0 /100 | #202 | Poor 2.2% |
Demographics Similar to Immigrants from Eastern Europe by Vision Disability
In terms of vision disability, the demographic groups most similar to Immigrants from Eastern Europe are Paraguayan (2.0%, a difference of 0.030%), Immigrants from Jordan (2.0%, a difference of 0.030%), Palestinian (2.0%, a difference of 0.050%), Immigrants from North Macedonia (2.0%, a difference of 0.050%), and Immigrants from Eritrea (2.0%, a difference of 0.11%).
| Demographics | Rating | Rank | Vision Disability |
| Immigrants | Northern Europe | 98.6 /100 | #71 | Exceptional 2.0% |
| Immigrants | France | 98.5 /100 | #72 | Exceptional 2.0% |
| Immigrants | Eritrea | 98.4 /100 | #73 | Exceptional 2.0% |
| Palestinians | 98.3 /100 | #74 | Exceptional 2.0% |
| Immigrants | North Macedonia | 98.3 /100 | #75 | Exceptional 2.0% |
| Paraguayans | 98.3 /100 | #76 | Exceptional 2.0% |
| Immigrants | Jordan | 98.3 /100 | #77 | Exceptional 2.0% |
| Immigrants | Eastern Europe | 98.3 /100 | #78 | Exceptional 2.0% |
| Assyrians/Chaldeans/Syriacs | 98.1 /100 | #79 | Exceptional 2.0% |
| Lithuanians | 97.7 /100 | #80 | Exceptional 2.0% |
| Soviet Union | 97.6 /100 | #81 | Exceptional 2.0% |
| Immigrants | Poland | 97.6 /100 | #82 | Exceptional 2.0% |
| Immigrants | Western Asia | 97.5 /100 | #83 | Exceptional 2.0% |
| Immigrants | Latvia | 97.3 /100 | #84 | Exceptional 2.0% |
| Chinese | 97.2 /100 | #85 | Exceptional 2.0% |