Immigrants from Korea vs Assyrian/Chaldean/Syriac Female Disability
COMPARE
Immigrants from Korea
Assyrian/Chaldean/Syriac
Female Disability
Female Disability Comparison
Immigrants from Korea
Assyrians/Chaldeans/Syriacs
10.6%
FEMALE DISABILITY
100.0/ 100
METRIC RATING
11th/ 347
METRIC RANK
12.5%
FEMALE DISABILITY
8.0/ 100
METRIC RATING
227th/ 347
METRIC RANK
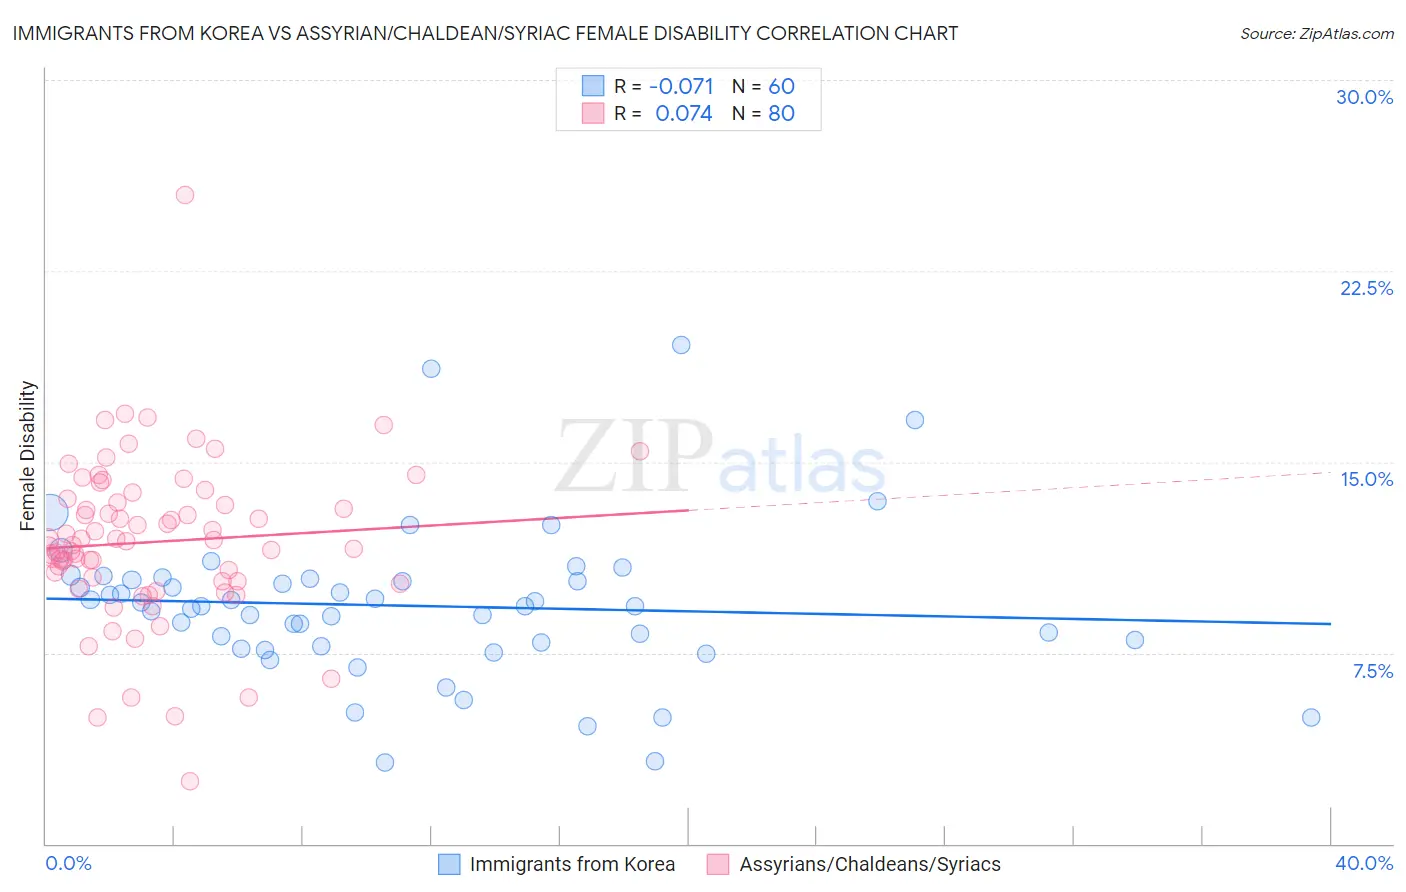
Immigrants from Korea vs Assyrian/Chaldean/Syriac Female Disability Correlation Chart
The statistical analysis conducted on geographies consisting of 416,288,361 people shows a slight negative correlation between the proportion of Immigrants from Korea and percentage of females with a disability in the United States with a correlation coefficient (R) of -0.071 and weighted average of 10.6%. Similarly, the statistical analysis conducted on geographies consisting of 110,312,508 people shows a slight positive correlation between the proportion of Assyrians/Chaldeans/Syriacs and percentage of females with a disability in the United States with a correlation coefficient (R) of 0.074 and weighted average of 12.5%, a difference of 17.3%.
Female Disability Correlation Summary
| Measurement | Immigrants from Korea | Assyrian/Chaldean/Syriac |
| Minimum | 3.2% | 2.4% |
| Maximum | 19.6% | 25.5% |
| Range | 16.4% | 23.0% |
| Mean | 9.4% | 11.9% |
| Median | 9.3% | 11.8% |
| Interquartile 25% (IQ1) | 7.8% | 10.3% |
| Interquartile 75% (IQ3) | 10.4% | 13.5% |
| Interquartile Range (IQR) | 2.6% | 3.1% |
| Standard Deviation (Sample) | 3.0% | 3.2% |
| Standard Deviation (Population) | 3.0% | 3.2% |
Similar Demographics by Female Disability
Demographics Similar to Immigrants from Korea by Female Disability
In terms of female disability, the demographic groups most similar to Immigrants from Korea are Immigrants from Hong Kong (10.6%, a difference of 0.17%), Immigrants from Israel (10.7%, a difference of 0.42%), Immigrants from Eastern Asia (10.7%, a difference of 0.49%), Immigrants from China (10.7%, a difference of 0.52%), and Iranian (10.6%, a difference of 0.82%).
| Demographics | Rating | Rank | Female Disability |
| Thais | 100.0 /100 | #4 | Exceptional 10.2% |
| Immigrants | Bolivia | 100.0 /100 | #5 | Exceptional 10.3% |
| Bolivians | 100.0 /100 | #6 | Exceptional 10.4% |
| Immigrants | Singapore | 100.0 /100 | #7 | Exceptional 10.4% |
| Immigrants | South Central Asia | 100.0 /100 | #8 | Exceptional 10.5% |
| Iranians | 100.0 /100 | #9 | Exceptional 10.6% |
| Immigrants | Hong Kong | 100.0 /100 | #10 | Exceptional 10.6% |
| Immigrants | Korea | 100.0 /100 | #11 | Exceptional 10.6% |
| Immigrants | Israel | 100.0 /100 | #12 | Exceptional 10.7% |
| Immigrants | Eastern Asia | 100.0 /100 | #13 | Exceptional 10.7% |
| Immigrants | China | 100.0 /100 | #14 | Exceptional 10.7% |
| Burmese | 100.0 /100 | #15 | Exceptional 10.7% |
| Okinawans | 100.0 /100 | #16 | Exceptional 10.8% |
| Indians (Asian) | 100.0 /100 | #17 | Exceptional 10.8% |
| Immigrants | Iran | 100.0 /100 | #18 | Exceptional 10.8% |
Demographics Similar to Assyrians/Chaldeans/Syriacs by Female Disability
In terms of female disability, the demographic groups most similar to Assyrians/Chaldeans/Syriacs are Hispanic or Latino (12.5%, a difference of 0.010%), Immigrants from Cambodia (12.5%, a difference of 0.030%), Polish (12.5%, a difference of 0.060%), Hungarian (12.5%, a difference of 0.10%), and Immigrants from Belize (12.5%, a difference of 0.13%).
| Demographics | Rating | Rank | Female Disability |
| Bahamians | 11.1 /100 | #220 | Poor 12.4% |
| Native Hawaiians | 10.8 /100 | #221 | Poor 12.4% |
| Italians | 10.7 /100 | #222 | Poor 12.4% |
| Guamanians/Chamorros | 9.5 /100 | #223 | Tragic 12.5% |
| Belizeans | 9.3 /100 | #224 | Tragic 12.5% |
| Poles | 8.4 /100 | #225 | Tragic 12.5% |
| Hispanics or Latinos | 8.0 /100 | #226 | Tragic 12.5% |
| Assyrians/Chaldeans/Syriacs | 8.0 /100 | #227 | Tragic 12.5% |
| Immigrants | Cambodia | 7.8 /100 | #228 | Tragic 12.5% |
| Hungarians | 7.2 /100 | #229 | Tragic 12.5% |
| Immigrants | Belize | 7.0 /100 | #230 | Tragic 12.5% |
| Belgians | 6.5 /100 | #231 | Tragic 12.5% |
| Immigrants | Somalia | 5.9 /100 | #232 | Tragic 12.5% |
| Immigrants | Iraq | 5.3 /100 | #233 | Tragic 12.5% |
| Scandinavians | 5.3 /100 | #234 | Tragic 12.5% |