Immigrants from Zaire vs Ecuadorian Female Disability
COMPARE
Immigrants from Zaire
Ecuadorian
Female Disability
Female Disability Comparison
Immigrants from Zaire
Ecuadorians
12.3%
FEMALE DISABILITY
20.9/ 100
METRIC RATING
204th/ 347
METRIC RANK
11.9%
FEMALE DISABILITY
93.4/ 100
METRIC RATING
138th/ 347
METRIC RANK
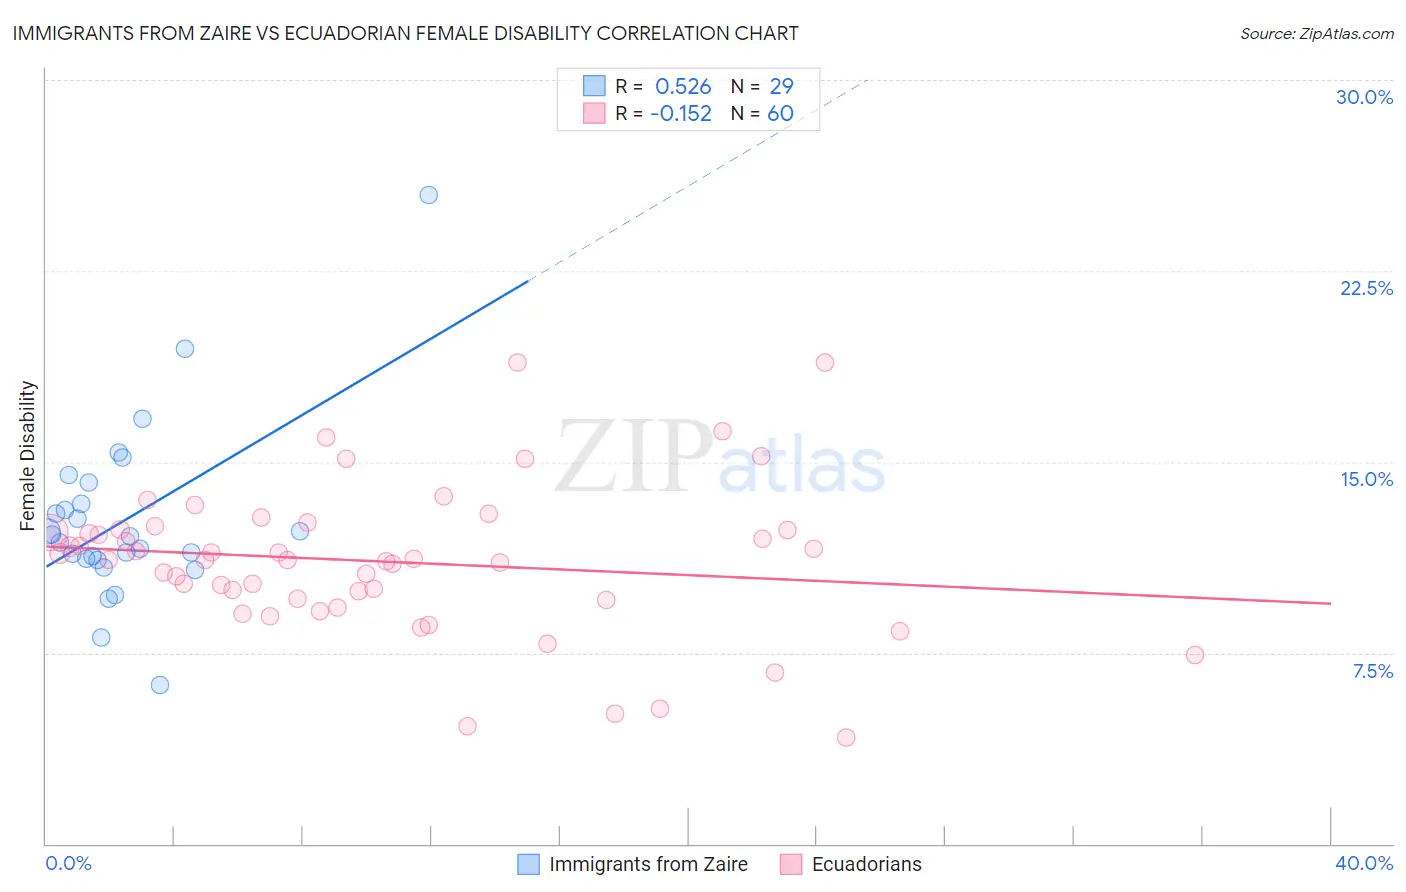
Immigrants from Zaire vs Ecuadorian Female Disability Correlation Chart
The statistical analysis conducted on geographies consisting of 107,254,316 people shows a substantial positive correlation between the proportion of Immigrants from Zaire and percentage of females with a disability in the United States with a correlation coefficient (R) of 0.526 and weighted average of 12.3%. Similarly, the statistical analysis conducted on geographies consisting of 317,804,285 people shows a poor negative correlation between the proportion of Ecuadorians and percentage of females with a disability in the United States with a correlation coefficient (R) of -0.152 and weighted average of 11.9%, a difference of 3.8%.
Female Disability Correlation Summary
| Measurement | Immigrants from Zaire | Ecuadorian |
| Minimum | 6.2% | 4.2% |
| Maximum | 25.5% | 18.9% |
| Range | 19.3% | 14.7% |
| Mean | 12.7% | 11.1% |
| Median | 12.1% | 11.2% |
| Interquartile 25% (IQ1) | 11.2% | 9.6% |
| Interquartile 75% (IQ3) | 13.8% | 12.3% |
| Interquartile Range (IQR) | 2.6% | 2.7% |
| Standard Deviation (Sample) | 3.5% | 2.9% |
| Standard Deviation (Population) | 3.5% | 2.9% |
Similar Demographics by Female Disability
Demographics Similar to Immigrants from Zaire by Female Disability
In terms of female disability, the demographic groups most similar to Immigrants from Zaire are Immigrants from Barbados (12.3%, a difference of 0.020%), Immigrants from Grenada (12.4%, a difference of 0.020%), Somali (12.3%, a difference of 0.040%), Immigrants from Cuba (12.4%, a difference of 0.040%), and Croatian (12.4%, a difference of 0.040%).
| Demographics | Rating | Rank | Female Disability |
| Hondurans | 25.4 /100 | #197 | Fair 12.3% |
| Mexican American Indians | 24.9 /100 | #198 | Fair 12.3% |
| Immigrants | Trinidad and Tobago | 24.7 /100 | #199 | Fair 12.3% |
| Trinidadians and Tobagonians | 22.4 /100 | #200 | Fair 12.3% |
| Chinese | 22.1 /100 | #201 | Fair 12.3% |
| Somalis | 21.5 /100 | #202 | Fair 12.3% |
| Immigrants | Barbados | 21.1 /100 | #203 | Fair 12.3% |
| Immigrants | Zaire | 20.9 /100 | #204 | Fair 12.3% |
| Immigrants | Grenada | 20.5 /100 | #205 | Fair 12.4% |
| Immigrants | Cuba | 20.2 /100 | #206 | Fair 12.4% |
| Croatians | 20.2 /100 | #207 | Fair 12.4% |
| Basques | 17.5 /100 | #208 | Poor 12.4% |
| Mexicans | 15.7 /100 | #209 | Poor 12.4% |
| Swiss | 14.9 /100 | #210 | Poor 12.4% |
| Immigrants | Bosnia and Herzegovina | 14.8 /100 | #211 | Poor 12.4% |
Demographics Similar to Ecuadorians by Female Disability
In terms of female disability, the demographic groups most similar to Ecuadorians are Immigrants from Norway (11.9%, a difference of 0.060%), Immigrants from Hungary (11.9%, a difference of 0.090%), Ugandan (11.9%, a difference of 0.10%), Central American (11.9%, a difference of 0.12%), and Kenyan (11.9%, a difference of 0.19%).
| Demographics | Rating | Rank | Female Disability |
| Arabs | 95.1 /100 | #131 | Exceptional 11.9% |
| Immigrants | Syria | 94.6 /100 | #132 | Exceptional 11.9% |
| Kenyans | 94.5 /100 | #133 | Exceptional 11.9% |
| Immigrants | Nicaragua | 94.5 /100 | #134 | Exceptional 11.9% |
| Central Americans | 94.2 /100 | #135 | Exceptional 11.9% |
| Ugandans | 94.0 /100 | #136 | Exceptional 11.9% |
| Immigrants | Norway | 93.8 /100 | #137 | Exceptional 11.9% |
| Ecuadorians | 93.4 /100 | #138 | Exceptional 11.9% |
| Immigrants | Hungary | 92.8 /100 | #139 | Exceptional 11.9% |
| Romanians | 91.6 /100 | #140 | Exceptional 11.9% |
| Immigrants | Ecuador | 91.5 /100 | #141 | Exceptional 11.9% |
| Immigrants | Africa | 90.0 /100 | #142 | Excellent 11.9% |
| Immigrants | Sudan | 89.6 /100 | #143 | Excellent 11.9% |
| Immigrants | Austria | 87.9 /100 | #144 | Excellent 12.0% |
| Estonians | 87.8 /100 | #145 | Excellent 12.0% |