Immigrants from Zaire vs Native Hawaiian Female Disability
COMPARE
Immigrants from Zaire
Native Hawaiian
Female Disability
Female Disability Comparison
Immigrants from Zaire
Native Hawaiians
12.3%
FEMALE DISABILITY
20.9/ 100
METRIC RATING
204th/ 347
METRIC RANK
12.4%
FEMALE DISABILITY
10.8/ 100
METRIC RATING
221st/ 347
METRIC RANK
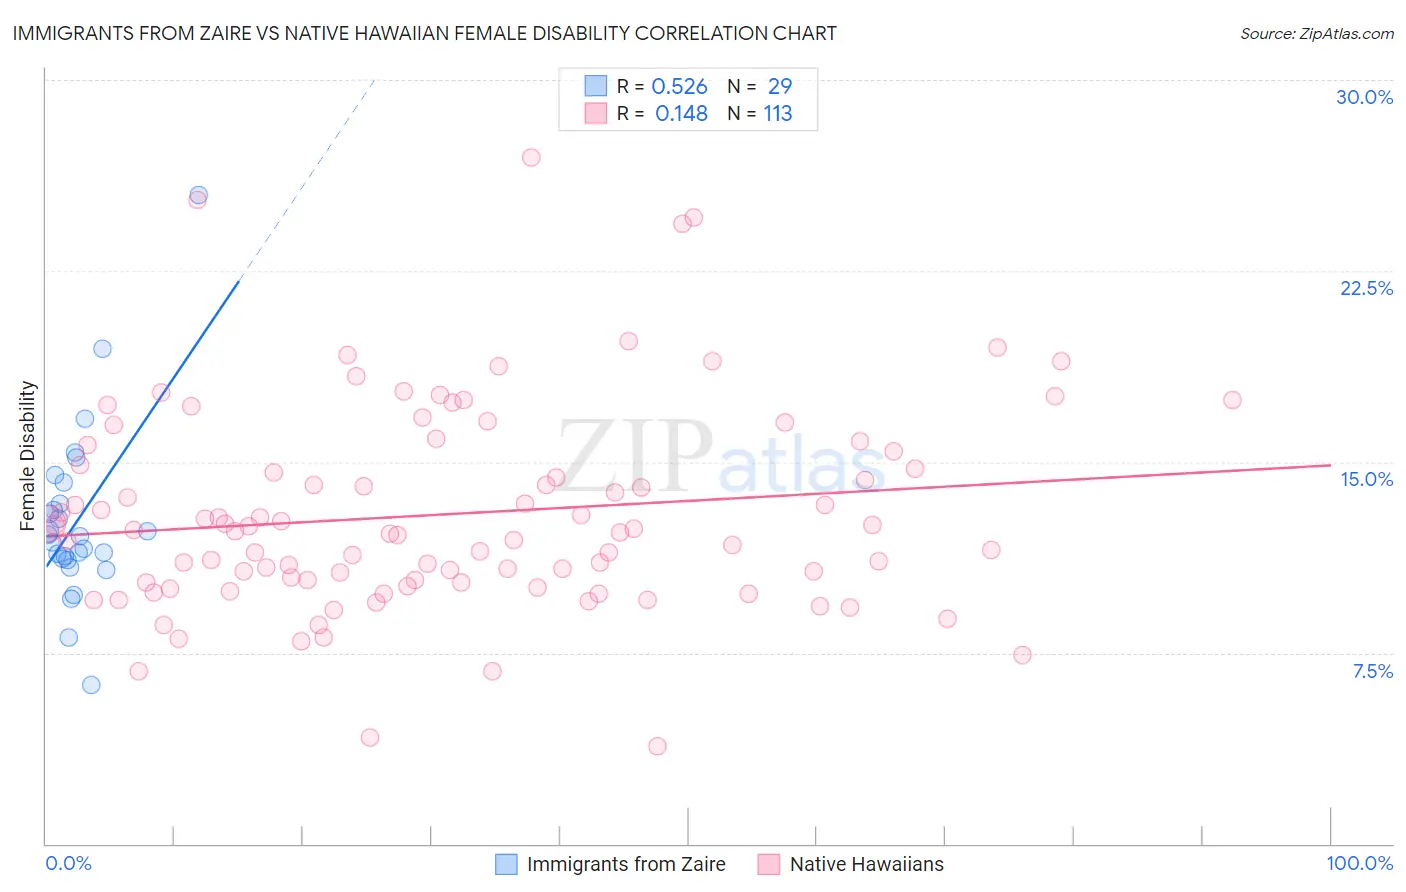
Immigrants from Zaire vs Native Hawaiian Female Disability Correlation Chart
The statistical analysis conducted on geographies consisting of 107,254,316 people shows a substantial positive correlation between the proportion of Immigrants from Zaire and percentage of females with a disability in the United States with a correlation coefficient (R) of 0.526 and weighted average of 12.3%. Similarly, the statistical analysis conducted on geographies consisting of 332,017,231 people shows a poor positive correlation between the proportion of Native Hawaiians and percentage of females with a disability in the United States with a correlation coefficient (R) of 0.148 and weighted average of 12.4%, a difference of 0.72%.
Female Disability Correlation Summary
| Measurement | Immigrants from Zaire | Native Hawaiian |
| Minimum | 6.2% | 3.9% |
| Maximum | 25.5% | 27.0% |
| Range | 19.3% | 23.1% |
| Mean | 12.7% | 13.0% |
| Median | 12.1% | 12.3% |
| Interquartile 25% (IQ1) | 11.2% | 10.3% |
| Interquartile 75% (IQ3) | 13.8% | 15.1% |
| Interquartile Range (IQR) | 2.6% | 4.9% |
| Standard Deviation (Sample) | 3.5% | 4.1% |
| Standard Deviation (Population) | 3.5% | 4.0% |
Demographics Similar to Immigrants from Zaire and Native Hawaiians by Female Disability
In terms of female disability, the demographic groups most similar to Immigrants from Zaire are Immigrants from Barbados (12.3%, a difference of 0.020%), Immigrants from Grenada (12.4%, a difference of 0.020%), Somali (12.3%, a difference of 0.040%), Immigrants from Cuba (12.4%, a difference of 0.040%), and Croatian (12.4%, a difference of 0.040%). Similarly, the demographic groups most similar to Native Hawaiians are Italian (12.4%, a difference of 0.010%), Bahamian (12.4%, a difference of 0.030%), European (12.4%, a difference of 0.12%), Immigrants from Bahamas (12.4%, a difference of 0.15%), and British (12.4%, a difference of 0.17%).
| Demographics | Rating | Rank | Female Disability |
| Somalis | 21.5 /100 | #202 | Fair 12.3% |
| Immigrants | Barbados | 21.1 /100 | #203 | Fair 12.3% |
| Immigrants | Zaire | 20.9 /100 | #204 | Fair 12.3% |
| Immigrants | Grenada | 20.5 /100 | #205 | Fair 12.4% |
| Immigrants | Cuba | 20.2 /100 | #206 | Fair 12.4% |
| Croatians | 20.2 /100 | #207 | Fair 12.4% |
| Basques | 17.5 /100 | #208 | Poor 12.4% |
| Mexicans | 15.7 /100 | #209 | Poor 12.4% |
| Swiss | 14.9 /100 | #210 | Poor 12.4% |
| Immigrants | Bosnia and Herzegovina | 14.8 /100 | #211 | Poor 12.4% |
| Ute | 14.7 /100 | #212 | Poor 12.4% |
| Immigrants | Thailand | 14.5 /100 | #213 | Poor 12.4% |
| Panamanians | 13.5 /100 | #214 | Poor 12.4% |
| Samoans | 13.4 /100 | #215 | Poor 12.4% |
| Immigrants | Burma/Myanmar | 13.3 /100 | #216 | Poor 12.4% |
| British | 12.7 /100 | #217 | Poor 12.4% |
| Immigrants | Bahamas | 12.5 /100 | #218 | Poor 12.4% |
| Europeans | 12.1 /100 | #219 | Poor 12.4% |
| Bahamians | 11.1 /100 | #220 | Poor 12.4% |
| Native Hawaiians | 10.8 /100 | #221 | Poor 12.4% |
| Italians | 10.7 /100 | #222 | Poor 12.4% |