Immigrants from North America vs Assyrian/Chaldean/Syriac Female Disability
COMPARE
Immigrants from North America
Assyrian/Chaldean/Syriac
Female Disability
Female Disability Comparison
Immigrants from North America
Assyrians/Chaldeans/Syriacs
12.3%
FEMALE DISABILITY
32.8/ 100
METRIC RATING
188th/ 347
METRIC RANK
12.5%
FEMALE DISABILITY
8.0/ 100
METRIC RATING
227th/ 347
METRIC RANK
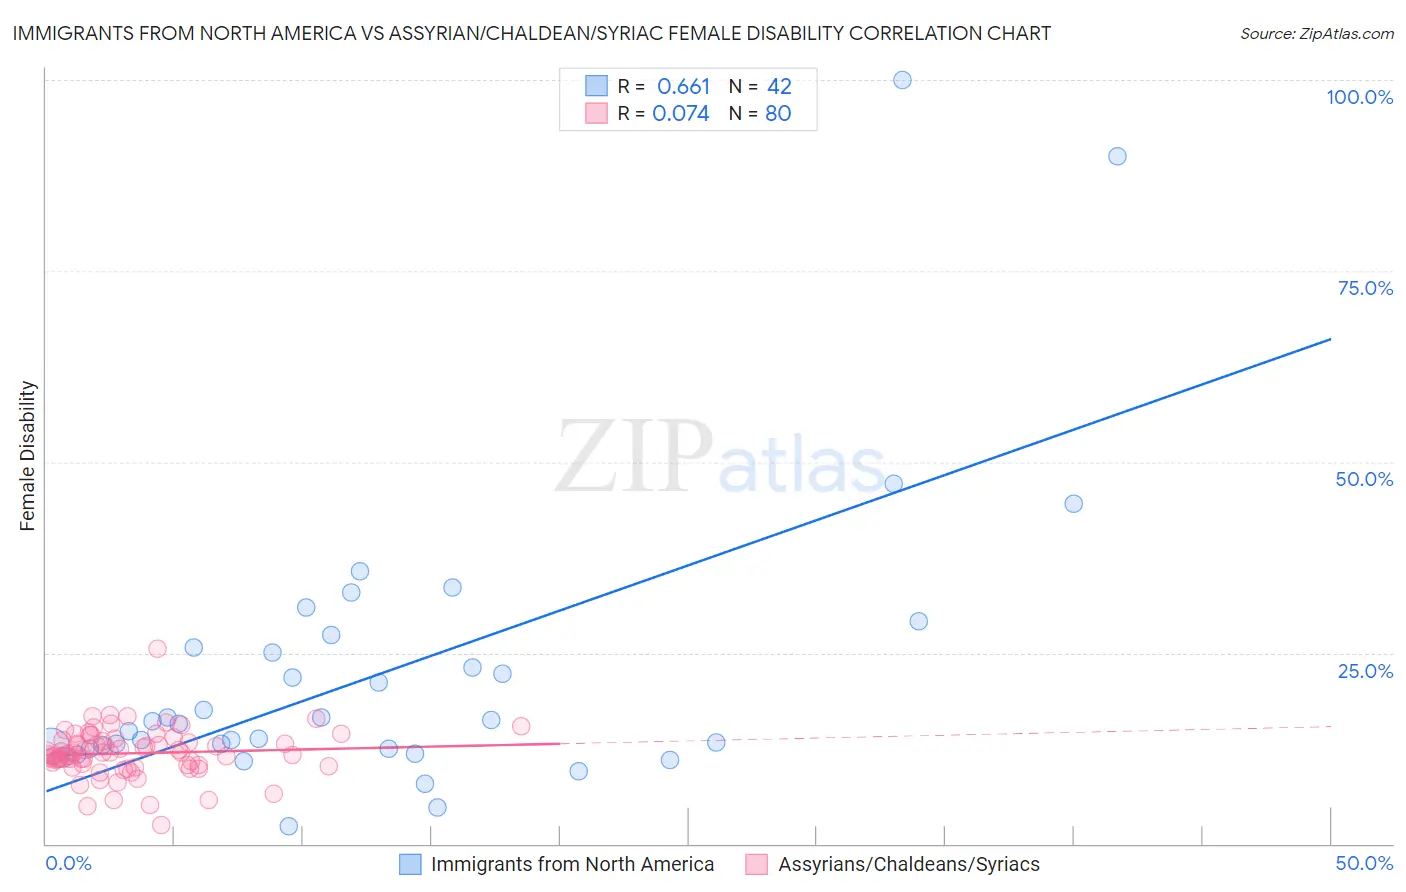
Immigrants from North America vs Assyrian/Chaldean/Syriac Female Disability Correlation Chart
The statistical analysis conducted on geographies consisting of 462,407,592 people shows a significant positive correlation between the proportion of Immigrants from North America and percentage of females with a disability in the United States with a correlation coefficient (R) of 0.661 and weighted average of 12.3%. Similarly, the statistical analysis conducted on geographies consisting of 110,312,508 people shows a slight positive correlation between the proportion of Assyrians/Chaldeans/Syriacs and percentage of females with a disability in the United States with a correlation coefficient (R) of 0.074 and weighted average of 12.5%, a difference of 1.6%.
Female Disability Correlation Summary
| Measurement | Immigrants from North America | Assyrian/Chaldean/Syriac |
| Minimum | 2.3% | 2.4% |
| Maximum | 100.0% | 25.5% |
| Range | 97.7% | 23.0% |
| Mean | 22.3% | 11.9% |
| Median | 15.9% | 11.8% |
| Interquartile 25% (IQ1) | 12.5% | 10.3% |
| Interquartile 75% (IQ3) | 25.7% | 13.5% |
| Interquartile Range (IQR) | 13.2% | 3.1% |
| Standard Deviation (Sample) | 19.2% | 3.2% |
| Standard Deviation (Population) | 19.0% | 3.2% |
Similar Demographics by Female Disability
Demographics Similar to Immigrants from North America by Female Disability
In terms of female disability, the demographic groups most similar to Immigrants from North America are Serbian (12.3%, a difference of 0.010%), Austrian (12.3%, a difference of 0.020%), Immigrants from Uzbekistan (12.3%, a difference of 0.050%), Immigrants from Albania (12.3%, a difference of 0.050%), and Immigrants from Honduras (12.3%, a difference of 0.060%).
| Demographics | Rating | Rank | Female Disability |
| Immigrants | Canada | 37.2 /100 | #181 | Fair 12.3% |
| Norwegians | 36.9 /100 | #182 | Fair 12.3% |
| Cubans | 36.5 /100 | #183 | Fair 12.3% |
| Iraqis | 36.0 /100 | #184 | Fair 12.3% |
| Immigrants | Uzbekistan | 33.9 /100 | #185 | Fair 12.3% |
| Austrians | 33.3 /100 | #186 | Fair 12.3% |
| Serbians | 33.1 /100 | #187 | Fair 12.3% |
| Immigrants | North America | 32.8 /100 | #188 | Fair 12.3% |
| Immigrants | Albania | 31.6 /100 | #189 | Fair 12.3% |
| Immigrants | Honduras | 31.3 /100 | #190 | Fair 12.3% |
| Armenians | 29.7 /100 | #191 | Fair 12.3% |
| Immigrants | Western Africa | 29.2 /100 | #192 | Fair 12.3% |
| Northern Europeans | 27.5 /100 | #193 | Fair 12.3% |
| Ukrainians | 27.2 /100 | #194 | Fair 12.3% |
| Swedes | 26.6 /100 | #195 | Fair 12.3% |
Demographics Similar to Assyrians/Chaldeans/Syriacs by Female Disability
In terms of female disability, the demographic groups most similar to Assyrians/Chaldeans/Syriacs are Hispanic or Latino (12.5%, a difference of 0.010%), Immigrants from Cambodia (12.5%, a difference of 0.030%), Polish (12.5%, a difference of 0.060%), Hungarian (12.5%, a difference of 0.10%), and Immigrants from Belize (12.5%, a difference of 0.13%).
| Demographics | Rating | Rank | Female Disability |
| Bahamians | 11.1 /100 | #220 | Poor 12.4% |
| Native Hawaiians | 10.8 /100 | #221 | Poor 12.4% |
| Italians | 10.7 /100 | #222 | Poor 12.4% |
| Guamanians/Chamorros | 9.5 /100 | #223 | Tragic 12.5% |
| Belizeans | 9.3 /100 | #224 | Tragic 12.5% |
| Poles | 8.4 /100 | #225 | Tragic 12.5% |
| Hispanics or Latinos | 8.0 /100 | #226 | Tragic 12.5% |
| Assyrians/Chaldeans/Syriacs | 8.0 /100 | #227 | Tragic 12.5% |
| Immigrants | Cambodia | 7.8 /100 | #228 | Tragic 12.5% |
| Hungarians | 7.2 /100 | #229 | Tragic 12.5% |
| Immigrants | Belize | 7.0 /100 | #230 | Tragic 12.5% |
| Belgians | 6.5 /100 | #231 | Tragic 12.5% |
| Immigrants | Somalia | 5.9 /100 | #232 | Tragic 12.5% |
| Immigrants | Iraq | 5.3 /100 | #233 | Tragic 12.5% |
| Scandinavians | 5.3 /100 | #234 | Tragic 12.5% |