Immigrants from Zimbabwe vs Assyrian/Chaldean/Syriac Female Disability
COMPARE
Immigrants from Zimbabwe
Assyrian/Chaldean/Syriac
Female Disability
Female Disability Comparison
Immigrants from Zimbabwe
Assyrians/Chaldeans/Syriacs
11.6%
FEMALE DISABILITY
99.5/ 100
METRIC RATING
91st/ 347
METRIC RANK
12.5%
FEMALE DISABILITY
8.0/ 100
METRIC RATING
227th/ 347
METRIC RANK
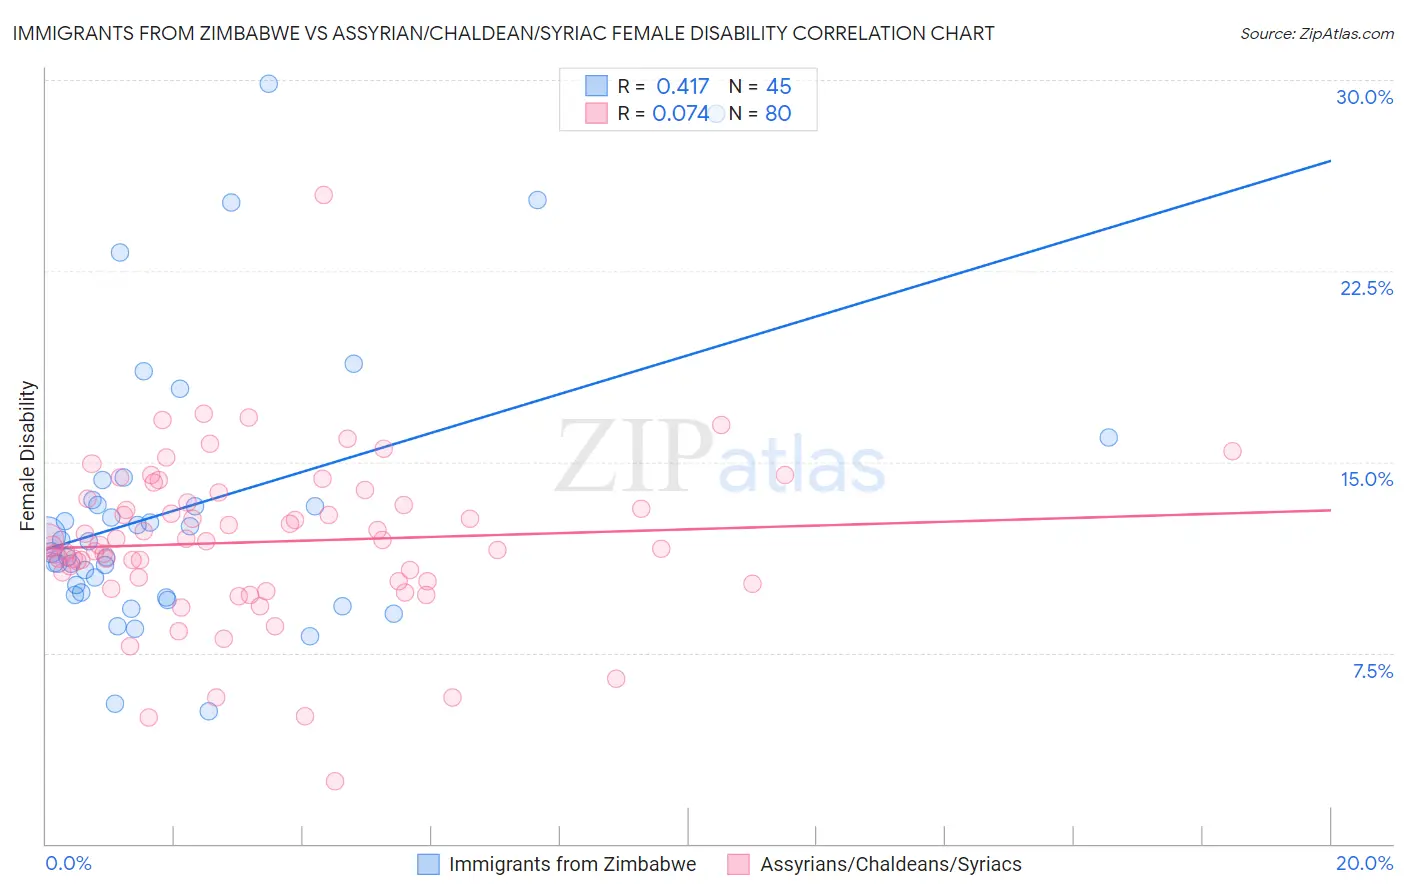
Immigrants from Zimbabwe vs Assyrian/Chaldean/Syriac Female Disability Correlation Chart
The statistical analysis conducted on geographies consisting of 117,810,271 people shows a moderate positive correlation between the proportion of Immigrants from Zimbabwe and percentage of females with a disability in the United States with a correlation coefficient (R) of 0.417 and weighted average of 11.6%. Similarly, the statistical analysis conducted on geographies consisting of 110,312,508 people shows a slight positive correlation between the proportion of Assyrians/Chaldeans/Syriacs and percentage of females with a disability in the United States with a correlation coefficient (R) of 0.074 and weighted average of 12.5%, a difference of 7.6%.
Female Disability Correlation Summary
| Measurement | Immigrants from Zimbabwe | Assyrian/Chaldean/Syriac |
| Minimum | 5.2% | 2.4% |
| Maximum | 29.8% | 25.5% |
| Range | 24.6% | 23.0% |
| Mean | 13.2% | 11.9% |
| Median | 11.9% | 11.8% |
| Interquartile 25% (IQ1) | 9.8% | 10.3% |
| Interquartile 75% (IQ3) | 13.9% | 13.5% |
| Interquartile Range (IQR) | 4.0% | 3.1% |
| Standard Deviation (Sample) | 5.5% | 3.2% |
| Standard Deviation (Population) | 5.5% | 3.2% |
Similar Demographics by Female Disability
Demographics Similar to Immigrants from Zimbabwe by Female Disability
In terms of female disability, the demographic groups most similar to Immigrants from Zimbabwe are Vietnamese (11.6%, a difference of 0.010%), Immigrants from Romania (11.6%, a difference of 0.010%), Immigrants from Czechoslovakia (11.6%, a difference of 0.010%), Immigrants from Denmark (11.6%, a difference of 0.11%), and Yup'ik (11.6%, a difference of 0.11%).
| Demographics | Rating | Rank | Female Disability |
| Immigrants | Poland | 99.6 /100 | #84 | Exceptional 11.6% |
| Palestinians | 99.6 /100 | #85 | Exceptional 11.6% |
| Immigrants | Cameroon | 99.6 /100 | #86 | Exceptional 11.6% |
| Immigrants | Denmark | 99.5 /100 | #87 | Exceptional 11.6% |
| Yup'ik | 99.5 /100 | #88 | Exceptional 11.6% |
| Vietnamese | 99.5 /100 | #89 | Exceptional 11.6% |
| Immigrants | Romania | 99.5 /100 | #90 | Exceptional 11.6% |
| Immigrants | Zimbabwe | 99.5 /100 | #91 | Exceptional 11.6% |
| Immigrants | Czechoslovakia | 99.5 /100 | #92 | Exceptional 11.6% |
| Immigrants | Sierra Leone | 99.4 /100 | #93 | Exceptional 11.6% |
| Immigrants | Brazil | 99.4 /100 | #94 | Exceptional 11.6% |
| Immigrants | Northern Europe | 99.4 /100 | #95 | Exceptional 11.6% |
| Immigrants | Russia | 99.0 /100 | #96 | Exceptional 11.7% |
| Koreans | 99.0 /100 | #97 | Exceptional 11.7% |
| Uruguayans | 98.8 /100 | #98 | Exceptional 11.7% |
Demographics Similar to Assyrians/Chaldeans/Syriacs by Female Disability
In terms of female disability, the demographic groups most similar to Assyrians/Chaldeans/Syriacs are Hispanic or Latino (12.5%, a difference of 0.010%), Immigrants from Cambodia (12.5%, a difference of 0.030%), Polish (12.5%, a difference of 0.060%), Hungarian (12.5%, a difference of 0.10%), and Immigrants from Belize (12.5%, a difference of 0.13%).
| Demographics | Rating | Rank | Female Disability |
| Bahamians | 11.1 /100 | #220 | Poor 12.4% |
| Native Hawaiians | 10.8 /100 | #221 | Poor 12.4% |
| Italians | 10.7 /100 | #222 | Poor 12.4% |
| Guamanians/Chamorros | 9.5 /100 | #223 | Tragic 12.5% |
| Belizeans | 9.3 /100 | #224 | Tragic 12.5% |
| Poles | 8.4 /100 | #225 | Tragic 12.5% |
| Hispanics or Latinos | 8.0 /100 | #226 | Tragic 12.5% |
| Assyrians/Chaldeans/Syriacs | 8.0 /100 | #227 | Tragic 12.5% |
| Immigrants | Cambodia | 7.8 /100 | #228 | Tragic 12.5% |
| Hungarians | 7.2 /100 | #229 | Tragic 12.5% |
| Immigrants | Belize | 7.0 /100 | #230 | Tragic 12.5% |
| Belgians | 6.5 /100 | #231 | Tragic 12.5% |
| Immigrants | Somalia | 5.9 /100 | #232 | Tragic 12.5% |
| Immigrants | Iraq | 5.3 /100 | #233 | Tragic 12.5% |
| Scandinavians | 5.3 /100 | #234 | Tragic 12.5% |