Immigrants from Europe vs Assyrian/Chaldean/Syriac Female Disability
COMPARE
Immigrants from Europe
Assyrian/Chaldean/Syriac
Female Disability
Female Disability Comparison
Immigrants from Europe
Assyrians/Chaldeans/Syriacs
11.8%
FEMALE DISABILITY
96.2/ 100
METRIC RATING
126th/ 347
METRIC RANK
12.5%
FEMALE DISABILITY
8.0/ 100
METRIC RATING
227th/ 347
METRIC RANK
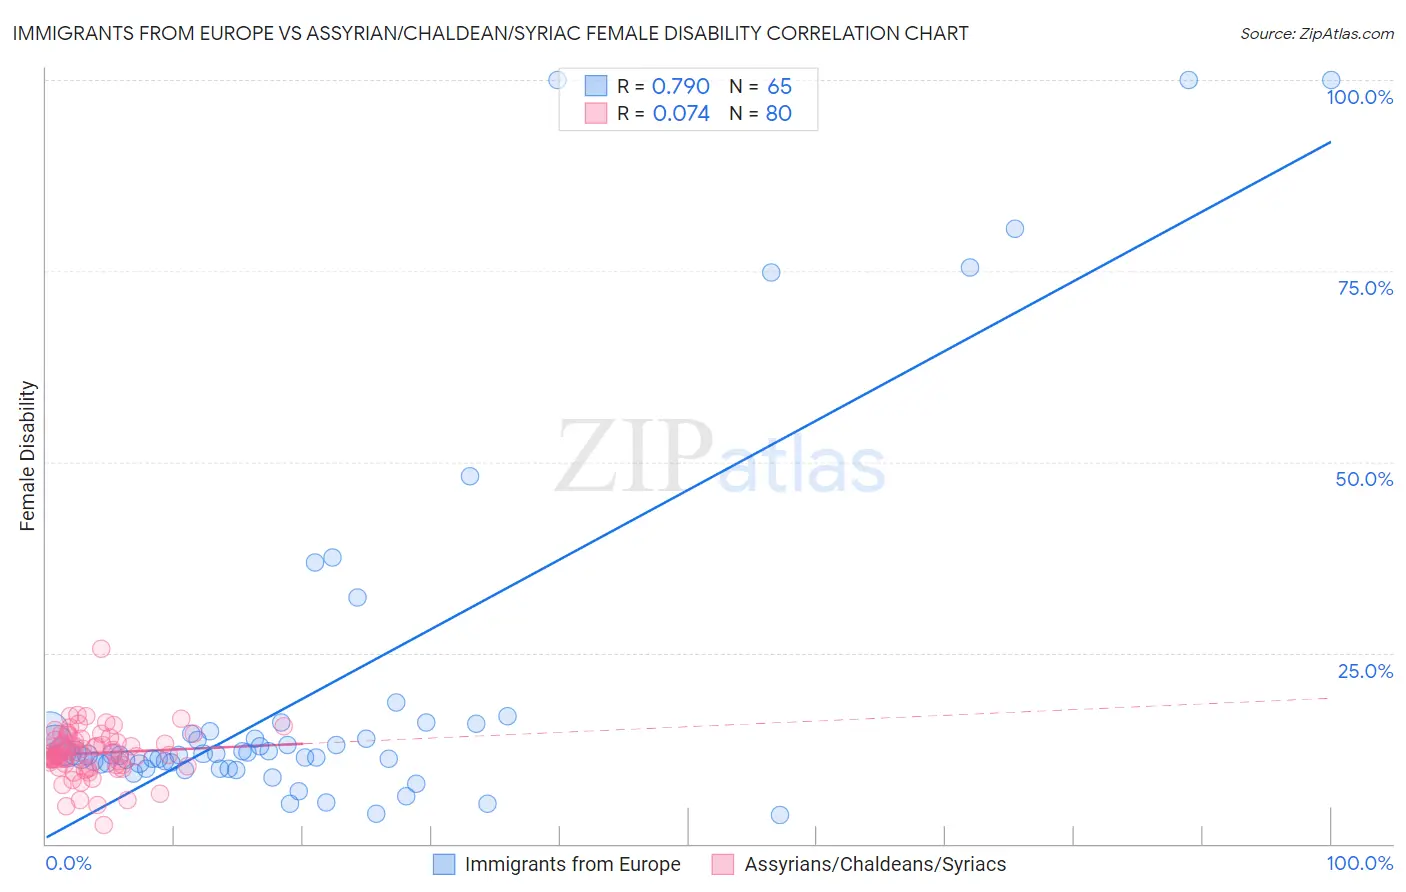
Immigrants from Europe vs Assyrian/Chaldean/Syriac Female Disability Correlation Chart
The statistical analysis conducted on geographies consisting of 547,243,236 people shows a strong positive correlation between the proportion of Immigrants from Europe and percentage of females with a disability in the United States with a correlation coefficient (R) of 0.790 and weighted average of 11.8%. Similarly, the statistical analysis conducted on geographies consisting of 110,312,508 people shows a slight positive correlation between the proportion of Assyrians/Chaldeans/Syriacs and percentage of females with a disability in the United States with a correlation coefficient (R) of 0.074 and weighted average of 12.5%, a difference of 5.5%.
Female Disability Correlation Summary
| Measurement | Immigrants from Europe | Assyrian/Chaldean/Syriac |
| Minimum | 3.8% | 2.4% |
| Maximum | 100.0% | 25.5% |
| Range | 96.2% | 23.0% |
| Mean | 20.0% | 11.9% |
| Median | 11.8% | 11.8% |
| Interquartile 25% (IQ1) | 10.5% | 10.3% |
| Interquartile 75% (IQ3) | 14.8% | 13.5% |
| Interquartile Range (IQR) | 4.3% | 3.1% |
| Standard Deviation (Sample) | 23.5% | 3.2% |
| Standard Deviation (Population) | 23.3% | 3.2% |
Similar Demographics by Female Disability
Demographics Similar to Immigrants from Europe by Female Disability
In terms of female disability, the demographic groups most similar to Immigrants from Europe are Immigrants from Italy (11.8%, a difference of 0.060%), Russian (11.8%, a difference of 0.090%), South American Indian (11.8%, a difference of 0.10%), Immigrants from Croatia (11.8%, a difference of 0.14%), and Immigrants from Latvia (11.8%, a difference of 0.14%).
| Demographics | Rating | Rank | Female Disability |
| Immigrants | Uganda | 97.2 /100 | #119 | Exceptional 11.8% |
| Immigrants | Kazakhstan | 97.0 /100 | #120 | Exceptional 11.8% |
| Immigrants | Netherlands | 96.9 /100 | #121 | Exceptional 11.8% |
| Immigrants | North Macedonia | 96.8 /100 | #122 | Exceptional 11.8% |
| Immigrants | Croatia | 96.7 /100 | #123 | Exceptional 11.8% |
| Russians | 96.5 /100 | #124 | Exceptional 11.8% |
| Immigrants | Italy | 96.4 /100 | #125 | Exceptional 11.8% |
| Immigrants | Europe | 96.2 /100 | #126 | Exceptional 11.8% |
| South American Indians | 95.8 /100 | #127 | Exceptional 11.8% |
| Immigrants | Latvia | 95.6 /100 | #128 | Exceptional 11.8% |
| Macedonians | 95.5 /100 | #129 | Exceptional 11.8% |
| Nicaraguans | 95.2 /100 | #130 | Exceptional 11.9% |
| Arabs | 95.1 /100 | #131 | Exceptional 11.9% |
| Immigrants | Syria | 94.6 /100 | #132 | Exceptional 11.9% |
| Kenyans | 94.5 /100 | #133 | Exceptional 11.9% |
Demographics Similar to Assyrians/Chaldeans/Syriacs by Female Disability
In terms of female disability, the demographic groups most similar to Assyrians/Chaldeans/Syriacs are Hispanic or Latino (12.5%, a difference of 0.010%), Immigrants from Cambodia (12.5%, a difference of 0.030%), Polish (12.5%, a difference of 0.060%), Hungarian (12.5%, a difference of 0.10%), and Immigrants from Belize (12.5%, a difference of 0.13%).
| Demographics | Rating | Rank | Female Disability |
| Bahamians | 11.1 /100 | #220 | Poor 12.4% |
| Native Hawaiians | 10.8 /100 | #221 | Poor 12.4% |
| Italians | 10.7 /100 | #222 | Poor 12.4% |
| Guamanians/Chamorros | 9.5 /100 | #223 | Tragic 12.5% |
| Belizeans | 9.3 /100 | #224 | Tragic 12.5% |
| Poles | 8.4 /100 | #225 | Tragic 12.5% |
| Hispanics or Latinos | 8.0 /100 | #226 | Tragic 12.5% |
| Assyrians/Chaldeans/Syriacs | 8.0 /100 | #227 | Tragic 12.5% |
| Immigrants | Cambodia | 7.8 /100 | #228 | Tragic 12.5% |
| Hungarians | 7.2 /100 | #229 | Tragic 12.5% |
| Immigrants | Belize | 7.0 /100 | #230 | Tragic 12.5% |
| Belgians | 6.5 /100 | #231 | Tragic 12.5% |
| Immigrants | Somalia | 5.9 /100 | #232 | Tragic 12.5% |
| Immigrants | Iraq | 5.3 /100 | #233 | Tragic 12.5% |
| Scandinavians | 5.3 /100 | #234 | Tragic 12.5% |