Immigrants from Yemen vs Immigrants from Cuba Disability
COMPARE
Immigrants from Yemen
Immigrants from Cuba
Disability
Disability Comparison
Immigrants from Yemen
Immigrants from Cuba
12.6%
DISABILITY
0.1/ 100
METRIC RATING
271st/ 347
METRIC RANK
11.6%
DISABILITY
62.8/ 100
METRIC RATING
161st/ 347
METRIC RANK
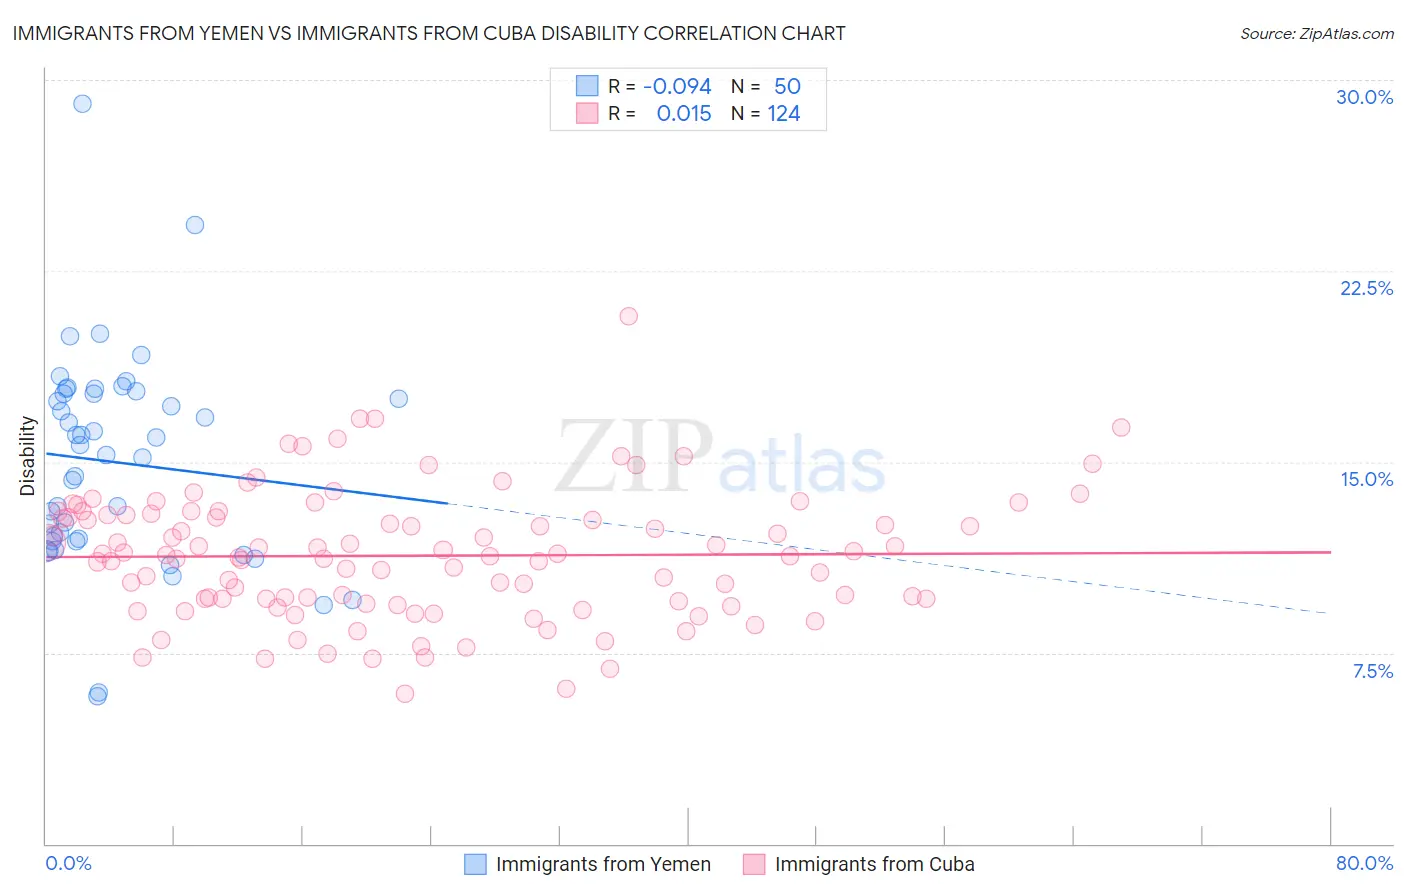
Immigrants from Yemen vs Immigrants from Cuba Disability Correlation Chart
The statistical analysis conducted on geographies consisting of 82,432,981 people shows a slight negative correlation between the proportion of Immigrants from Yemen and percentage of population with a disability in the United States with a correlation coefficient (R) of -0.094 and weighted average of 12.6%. Similarly, the statistical analysis conducted on geographies consisting of 325,999,543 people shows no correlation between the proportion of Immigrants from Cuba and percentage of population with a disability in the United States with a correlation coefficient (R) of 0.015 and weighted average of 11.6%, a difference of 8.6%.
Disability Correlation Summary
| Measurement | Immigrants from Yemen | Immigrants from Cuba |
| Minimum | 5.8% | 5.9% |
| Maximum | 29.1% | 20.7% |
| Range | 23.3% | 14.8% |
| Mean | 15.0% | 11.3% |
| Median | 15.5% | 11.3% |
| Interquartile 25% (IQ1) | 11.9% | 9.6% |
| Interquartile 75% (IQ3) | 17.7% | 12.9% |
| Interquartile Range (IQR) | 5.8% | 3.3% |
| Standard Deviation (Sample) | 4.2% | 2.5% |
| Standard Deviation (Population) | 4.1% | 2.5% |
Similar Demographics by Disability
Demographics Similar to Immigrants from Yemen by Disability
In terms of disability, the demographic groups most similar to Immigrants from Yemen are Portuguese (12.6%, a difference of 0.050%), Immigrants from Dominican Republic (12.6%, a difference of 0.44%), Dominican (12.7%, a difference of 0.49%), Bangladeshi (12.6%, a difference of 0.53%), and Finnish (12.7%, a difference of 0.66%).
| Demographics | Rating | Rank | Disability |
| Immigrants | Germany | 0.2 /100 | #264 | Tragic 12.5% |
| U.S. Virgin Islanders | 0.2 /100 | #265 | Tragic 12.5% |
| Czechoslovakians | 0.2 /100 | #266 | Tragic 12.5% |
| Spaniards | 0.2 /100 | #267 | Tragic 12.5% |
| Bangladeshis | 0.1 /100 | #268 | Tragic 12.6% |
| Immigrants | Dominican Republic | 0.1 /100 | #269 | Tragic 12.6% |
| Portuguese | 0.1 /100 | #270 | Tragic 12.6% |
| Immigrants | Yemen | 0.1 /100 | #271 | Tragic 12.6% |
| Dominicans | 0.0 /100 | #272 | Tragic 12.7% |
| Finns | 0.0 /100 | #273 | Tragic 12.7% |
| Nepalese | 0.0 /100 | #274 | Tragic 12.8% |
| Sioux | 0.0 /100 | #275 | Tragic 12.8% |
| Hmong | 0.0 /100 | #276 | Tragic 12.8% |
| Dutch | 0.0 /100 | #277 | Tragic 12.8% |
| Germans | 0.0 /100 | #278 | Tragic 12.8% |
Demographics Similar to Immigrants from Cuba by Disability
In terms of disability, the demographic groups most similar to Immigrants from Cuba are Immigrants from Barbados (11.6%, a difference of 0.070%), Guatemalan (11.6%, a difference of 0.11%), Armenian (11.6%, a difference of 0.15%), Immigrants from Haiti (11.7%, a difference of 0.17%), and Immigrants from Trinidad and Tobago (11.7%, a difference of 0.19%).
| Demographics | Rating | Rank | Disability |
| Immigrants | Guatemala | 71.1 /100 | #154 | Good 11.6% |
| Immigrants | Netherlands | 69.8 /100 | #155 | Good 11.6% |
| Immigrants | Fiji | 69.5 /100 | #156 | Good 11.6% |
| Immigrants | Middle Africa | 69.5 /100 | #157 | Good 11.6% |
| Armenians | 65.9 /100 | #158 | Good 11.6% |
| Guatemalans | 65.1 /100 | #159 | Good 11.6% |
| Immigrants | Barbados | 64.2 /100 | #160 | Good 11.6% |
| Immigrants | Cuba | 62.8 /100 | #161 | Good 11.6% |
| Immigrants | Haiti | 59.2 /100 | #162 | Average 11.7% |
| Immigrants | Trinidad and Tobago | 58.9 /100 | #163 | Average 11.7% |
| Syrians | 58.5 /100 | #164 | Average 11.7% |
| Cubans | 56.7 /100 | #165 | Average 11.7% |
| Pakistanis | 54.7 /100 | #166 | Average 11.7% |
| Estonians | 54.4 /100 | #167 | Average 11.7% |
| Immigrants | Latin America | 54.1 /100 | #168 | Average 11.7% |