Immigrants from Yemen vs Guamanian/Chamorro In Labor Force | Age 16-19
COMPARE
Immigrants from Yemen
Guamanian/Chamorro
In Labor Force | Age 16-19
In Labor Force | Age 16-19 Comparison
Immigrants from Yemen
Guamanians/Chamorros
31.5%
IN LABOR FORCE | AGE 16-19
0.0/ 100
METRIC RATING
318th/ 347
METRIC RANK
38.2%
IN LABOR FORCE | AGE 16-19
97.4/ 100
METRIC RATING
122nd/ 347
METRIC RANK
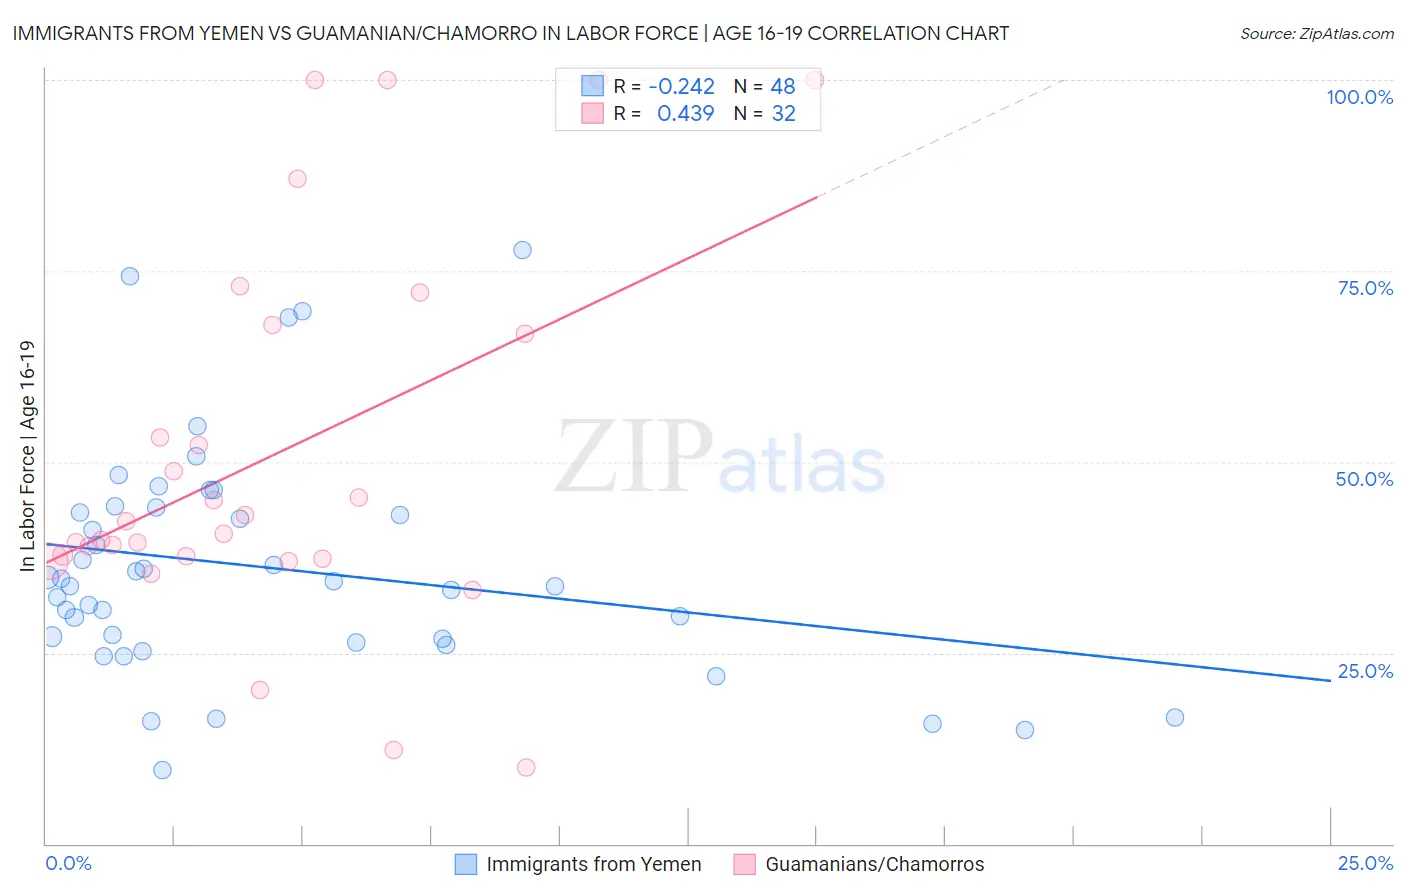
Immigrants from Yemen vs Guamanian/Chamorro In Labor Force | Age 16-19 Correlation Chart
The statistical analysis conducted on geographies consisting of 82,404,771 people shows a weak negative correlation between the proportion of Immigrants from Yemen and labor force participation rate among population between the ages 16 and 19 in the United States with a correlation coefficient (R) of -0.242 and weighted average of 31.5%. Similarly, the statistical analysis conducted on geographies consisting of 221,811,723 people shows a moderate positive correlation between the proportion of Guamanians/Chamorros and labor force participation rate among population between the ages 16 and 19 in the United States with a correlation coefficient (R) of 0.439 and weighted average of 38.2%, a difference of 21.3%.
In Labor Force | Age 16-19 Correlation Summary
| Measurement | Immigrants from Yemen | Guamanian/Chamorro |
| Minimum | 9.6% | 10.0% |
| Maximum | 77.8% | 100.0% |
| Range | 68.2% | 90.0% |
| Mean | 36.1% | 51.0% |
| Median | 34.1% | 41.4% |
| Interquartile 25% (IQ1) | 26.6% | 37.5% |
| Interquartile 75% (IQ3) | 43.7% | 67.3% |
| Interquartile Range (IQR) | 17.0% | 29.8% |
| Standard Deviation (Sample) | 15.1% | 24.8% |
| Standard Deviation (Population) | 14.9% | 24.4% |
Similar Demographics by In Labor Force | Age 16-19
Demographics Similar to Immigrants from Yemen by In Labor Force | Age 16-19
In terms of in labor force | age 16-19, the demographic groups most similar to Immigrants from Yemen are Soviet Union (31.4%, a difference of 0.32%), Immigrants from Nicaragua (31.6%, a difference of 0.34%), Ecuadorian (31.4%, a difference of 0.38%), Filipino (31.7%, a difference of 0.53%), and Immigrants from West Indies (31.7%, a difference of 0.62%).
| Demographics | Rating | Rank | In Labor Force | Age 16-19 |
| Indians (Asian) | 0.0 /100 | #311 | Tragic 31.9% |
| Immigrants | Belize | 0.0 /100 | #312 | Tragic 31.8% |
| Hopi | 0.0 /100 | #313 | Tragic 31.8% |
| Cubans | 0.0 /100 | #314 | Tragic 31.8% |
| Immigrants | West Indies | 0.0 /100 | #315 | Tragic 31.7% |
| Filipinos | 0.0 /100 | #316 | Tragic 31.7% |
| Immigrants | Nicaragua | 0.0 /100 | #317 | Tragic 31.6% |
| Immigrants | Yemen | 0.0 /100 | #318 | Tragic 31.5% |
| Soviet Union | 0.0 /100 | #319 | Tragic 31.4% |
| Ecuadorians | 0.0 /100 | #320 | Tragic 31.4% |
| West Indians | 0.0 /100 | #321 | Tragic 31.3% |
| Tohono O'odham | 0.0 /100 | #322 | Tragic 31.3% |
| Immigrants | Caribbean | 0.0 /100 | #323 | Tragic 31.2% |
| Dominicans | 0.0 /100 | #324 | Tragic 31.2% |
| Immigrants | China | 0.0 /100 | #325 | Tragic 31.1% |
Demographics Similar to Guamanians/Chamorros by In Labor Force | Age 16-19
In terms of in labor force | age 16-19, the demographic groups most similar to Guamanians/Chamorros are Ethiopian (38.2%, a difference of 0.030%), Ukrainian (38.3%, a difference of 0.13%), Assyrian/Chaldean/Syriac (38.3%, a difference of 0.22%), Immigrants from Nepal (38.3%, a difference of 0.23%), and Chickasaw (38.3%, a difference of 0.25%).
| Demographics | Rating | Rank | In Labor Force | Age 16-19 |
| Bulgarians | 97.9 /100 | #115 | Exceptional 38.3% |
| Colville | 97.9 /100 | #116 | Exceptional 38.3% |
| Chickasaw | 97.8 /100 | #117 | Exceptional 38.3% |
| Immigrants | Nepal | 97.8 /100 | #118 | Exceptional 38.3% |
| Assyrians/Chaldeans/Syriacs | 97.8 /100 | #119 | Exceptional 38.3% |
| Ukrainians | 97.6 /100 | #120 | Exceptional 38.3% |
| Ethiopians | 97.4 /100 | #121 | Exceptional 38.2% |
| Guamanians/Chamorros | 97.4 /100 | #122 | Exceptional 38.2% |
| Seminole | 96.7 /100 | #123 | Exceptional 38.1% |
| Immigrants | England | 96.4 /100 | #124 | Exceptional 38.1% |
| Immigrants | Africa | 96.1 /100 | #125 | Exceptional 38.0% |
| Africans | 95.6 /100 | #126 | Exceptional 38.0% |
| Choctaw | 95.6 /100 | #127 | Exceptional 38.0% |
| New Zealanders | 95.6 /100 | #128 | Exceptional 38.0% |
| Spaniards | 95.5 /100 | #129 | Exceptional 38.0% |