Immigrants from Yemen vs Estonian Ambulatory Disability
COMPARE
Immigrants from Yemen
Estonian
Ambulatory Disability
Ambulatory Disability Comparison
Immigrants from Yemen
Estonians
7.1%
AMBULATORY DISABILITY
0.0/ 100
METRIC RATING
313th/ 347
METRIC RANK
5.9%
AMBULATORY DISABILITY
92.9/ 100
METRIC RATING
120th/ 347
METRIC RANK
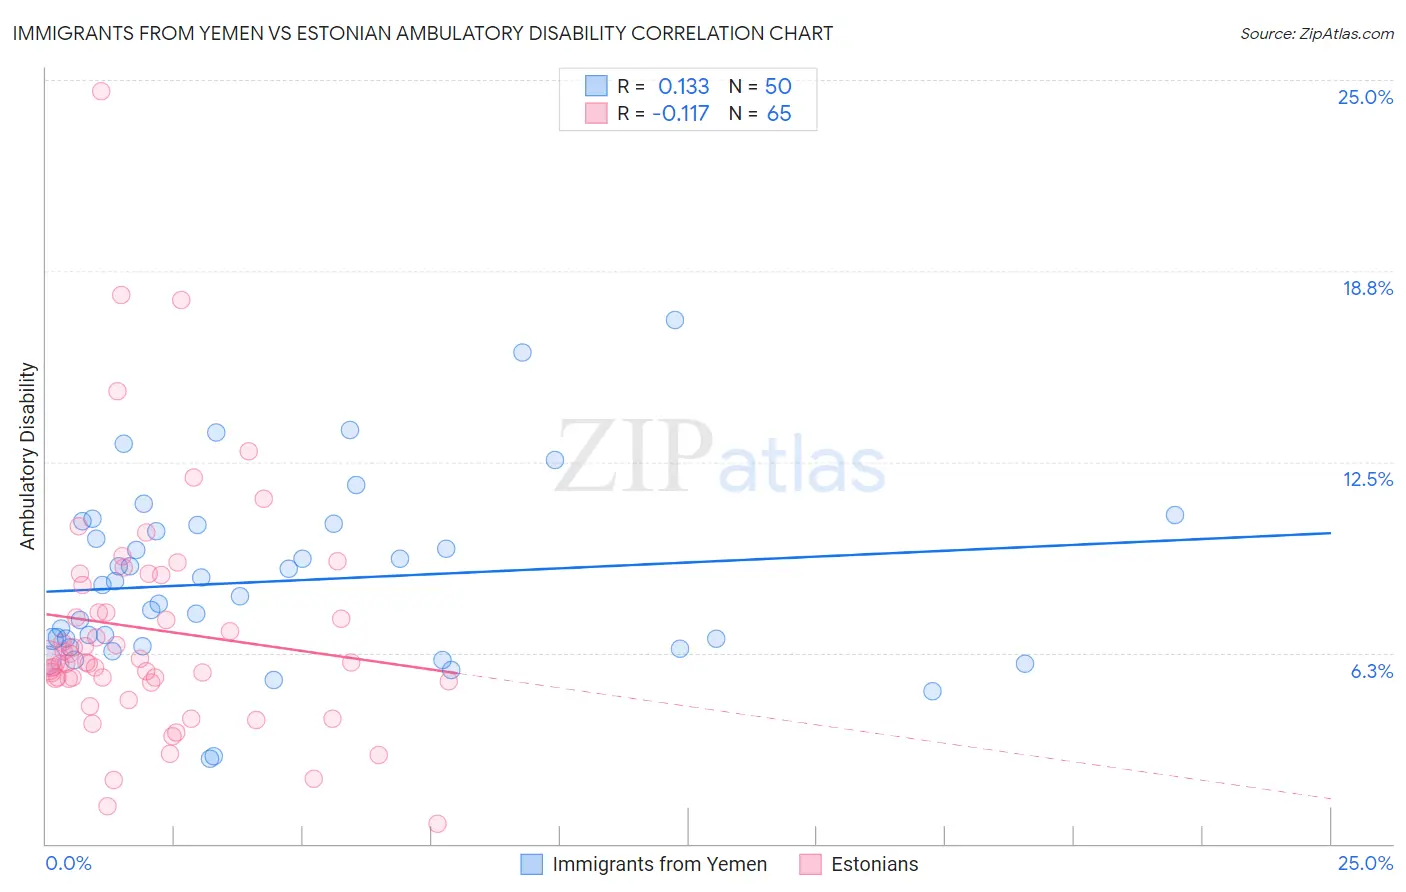
Immigrants from Yemen vs Estonian Ambulatory Disability Correlation Chart
The statistical analysis conducted on geographies consisting of 82,432,015 people shows a poor positive correlation between the proportion of Immigrants from Yemen and percentage of population with ambulatory disability in the United States with a correlation coefficient (R) of 0.133 and weighted average of 7.1%. Similarly, the statistical analysis conducted on geographies consisting of 123,516,931 people shows a poor negative correlation between the proportion of Estonians and percentage of population with ambulatory disability in the United States with a correlation coefficient (R) of -0.117 and weighted average of 5.9%, a difference of 20.6%.
Ambulatory Disability Correlation Summary
| Measurement | Immigrants from Yemen | Estonian |
| Minimum | 2.8% | 0.64% |
| Maximum | 17.1% | 24.6% |
| Range | 14.4% | 24.0% |
| Mean | 8.6% | 7.0% |
| Median | 8.3% | 5.9% |
| Interquartile 25% (IQ1) | 6.4% | 5.4% |
| Interquartile 75% (IQ3) | 10.4% | 8.6% |
| Interquartile Range (IQR) | 4.0% | 3.3% |
| Standard Deviation (Sample) | 3.0% | 4.0% |
| Standard Deviation (Population) | 2.9% | 3.9% |
Similar Demographics by Ambulatory Disability
Demographics Similar to Immigrants from Yemen by Ambulatory Disability
In terms of ambulatory disability, the demographic groups most similar to Immigrants from Yemen are Blackfeet (7.1%, a difference of 0.020%), Shoshone (7.1%, a difference of 0.040%), Delaware (7.1%, a difference of 0.13%), Immigrants from Dominican Republic (7.1%, a difference of 0.28%), and Cree (7.1%, a difference of 0.35%).
| Demographics | Rating | Rank | Ambulatory Disability |
| Iroquois | 0.0 /100 | #306 | Tragic 7.1% |
| Spanish Americans | 0.0 /100 | #307 | Tragic 7.1% |
| Chippewa | 0.0 /100 | #308 | Tragic 7.1% |
| Immigrants | Azores | 0.0 /100 | #309 | Tragic 7.1% |
| Arapaho | 0.0 /100 | #310 | Tragic 7.1% |
| Cree | 0.0 /100 | #311 | Tragic 7.1% |
| Delaware | 0.0 /100 | #312 | Tragic 7.1% |
| Immigrants | Yemen | 0.0 /100 | #313 | Tragic 7.1% |
| Blackfeet | 0.0 /100 | #314 | Tragic 7.1% |
| Shoshone | 0.0 /100 | #315 | Tragic 7.1% |
| Immigrants | Dominican Republic | 0.0 /100 | #316 | Tragic 7.1% |
| Central American Indians | 0.0 /100 | #317 | Tragic 7.2% |
| Ottawa | 0.0 /100 | #318 | Tragic 7.2% |
| Dominicans | 0.0 /100 | #319 | Tragic 7.2% |
| Potawatomi | 0.0 /100 | #320 | Tragic 7.3% |
Demographics Similar to Estonians by Ambulatory Disability
In terms of ambulatory disability, the demographic groups most similar to Estonians are Norwegian (5.9%, a difference of 0.040%), Costa Rican (5.9%, a difference of 0.070%), Icelander (5.9%, a difference of 0.070%), Immigrants from Russia (5.9%, a difference of 0.10%), and Russian (5.9%, a difference of 0.11%).
| Demographics | Rating | Rank | Ambulatory Disability |
| Immigrants | Uruguay | 95.6 /100 | #113 | Exceptional 5.9% |
| Immigrants | Poland | 95.4 /100 | #114 | Exceptional 5.9% |
| South American Indians | 94.8 /100 | #115 | Exceptional 5.9% |
| Immigrants | Africa | 94.7 /100 | #116 | Exceptional 5.9% |
| Immigrants | South Eastern Asia | 93.6 /100 | #117 | Exceptional 5.9% |
| Russians | 93.4 /100 | #118 | Exceptional 5.9% |
| Norwegians | 93.1 /100 | #119 | Exceptional 5.9% |
| Estonians | 92.9 /100 | #120 | Exceptional 5.9% |
| Costa Ricans | 92.6 /100 | #121 | Exceptional 5.9% |
| Icelanders | 92.6 /100 | #122 | Exceptional 5.9% |
| Immigrants | Russia | 92.4 /100 | #123 | Exceptional 5.9% |
| Immigrants | Middle Africa | 92.2 /100 | #124 | Exceptional 5.9% |
| Koreans | 91.6 /100 | #125 | Exceptional 5.9% |
| Arabs | 91.5 /100 | #126 | Exceptional 5.9% |
| Immigrants | Nigeria | 90.9 /100 | #127 | Exceptional 5.9% |