Immigrants from Yemen vs Ethiopian Ambulatory Disability
COMPARE
Immigrants from Yemen
Ethiopian
Ambulatory Disability
Ambulatory Disability Comparison
Immigrants from Yemen
Ethiopians
7.1%
AMBULATORY DISABILITY
0.0/ 100
METRIC RATING
313th/ 347
METRIC RANK
5.4%
AMBULATORY DISABILITY
100.0/ 100
METRIC RATING
20th/ 347
METRIC RANK
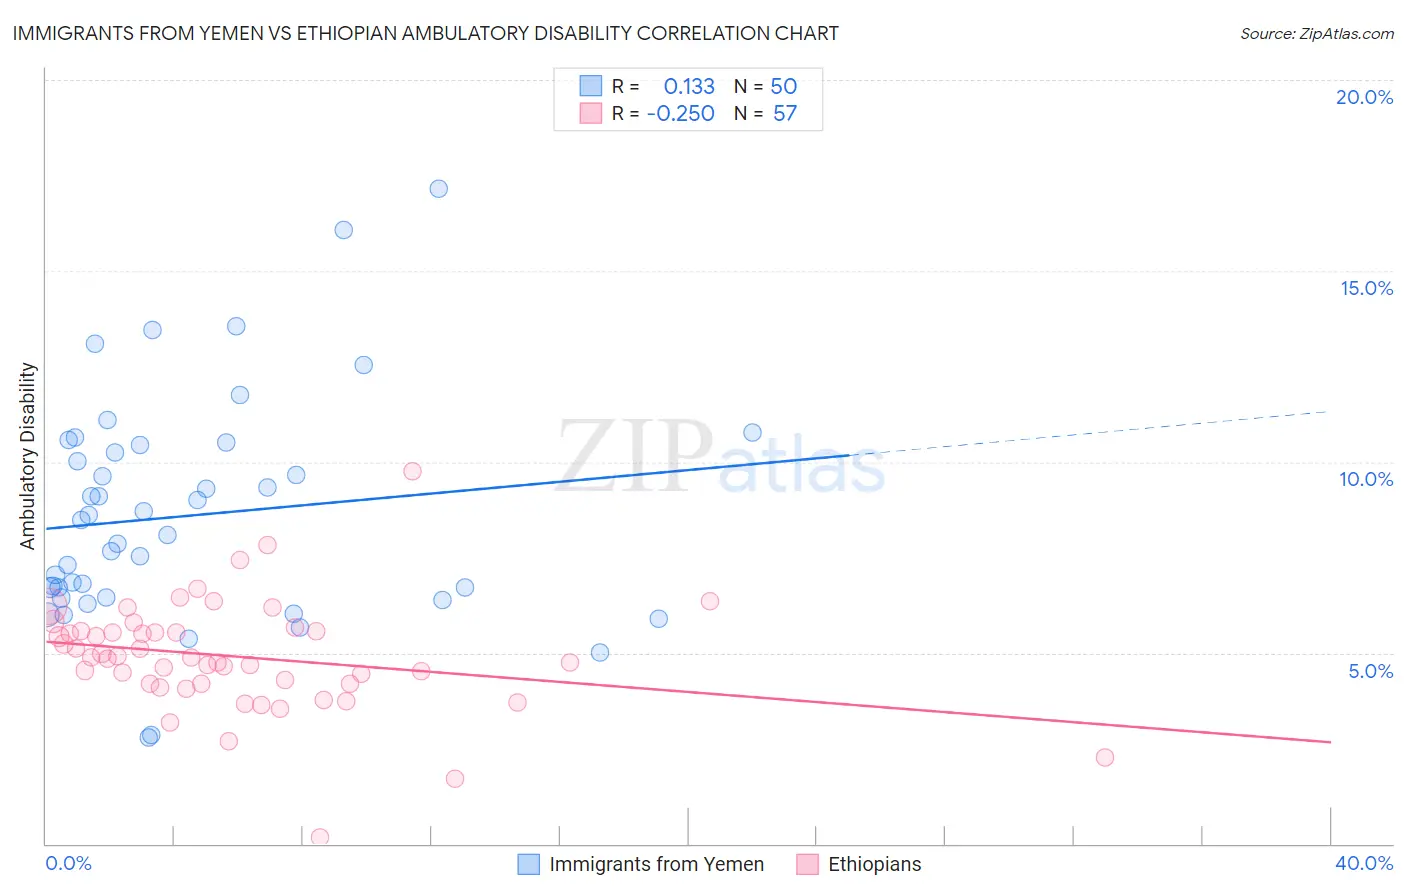
Immigrants from Yemen vs Ethiopian Ambulatory Disability Correlation Chart
The statistical analysis conducted on geographies consisting of 82,432,015 people shows a poor positive correlation between the proportion of Immigrants from Yemen and percentage of population with ambulatory disability in the United States with a correlation coefficient (R) of 0.133 and weighted average of 7.1%. Similarly, the statistical analysis conducted on geographies consisting of 223,167,947 people shows a weak negative correlation between the proportion of Ethiopians and percentage of population with ambulatory disability in the United States with a correlation coefficient (R) of -0.250 and weighted average of 5.4%, a difference of 32.9%.
Ambulatory Disability Correlation Summary
| Measurement | Immigrants from Yemen | Ethiopian |
| Minimum | 2.8% | 0.17% |
| Maximum | 17.1% | 9.8% |
| Range | 14.4% | 9.6% |
| Mean | 8.6% | 4.9% |
| Median | 8.3% | 4.9% |
| Interquartile 25% (IQ1) | 6.4% | 4.2% |
| Interquartile 75% (IQ3) | 10.4% | 5.6% |
| Interquartile Range (IQR) | 4.0% | 1.4% |
| Standard Deviation (Sample) | 3.0% | 1.5% |
| Standard Deviation (Population) | 2.9% | 1.5% |
Similar Demographics by Ambulatory Disability
Demographics Similar to Immigrants from Yemen by Ambulatory Disability
In terms of ambulatory disability, the demographic groups most similar to Immigrants from Yemen are Blackfeet (7.1%, a difference of 0.020%), Shoshone (7.1%, a difference of 0.040%), Delaware (7.1%, a difference of 0.13%), Immigrants from Dominican Republic (7.1%, a difference of 0.28%), and Cree (7.1%, a difference of 0.35%).
| Demographics | Rating | Rank | Ambulatory Disability |
| Iroquois | 0.0 /100 | #306 | Tragic 7.1% |
| Spanish Americans | 0.0 /100 | #307 | Tragic 7.1% |
| Chippewa | 0.0 /100 | #308 | Tragic 7.1% |
| Immigrants | Azores | 0.0 /100 | #309 | Tragic 7.1% |
| Arapaho | 0.0 /100 | #310 | Tragic 7.1% |
| Cree | 0.0 /100 | #311 | Tragic 7.1% |
| Delaware | 0.0 /100 | #312 | Tragic 7.1% |
| Immigrants | Yemen | 0.0 /100 | #313 | Tragic 7.1% |
| Blackfeet | 0.0 /100 | #314 | Tragic 7.1% |
| Shoshone | 0.0 /100 | #315 | Tragic 7.1% |
| Immigrants | Dominican Republic | 0.0 /100 | #316 | Tragic 7.1% |
| Central American Indians | 0.0 /100 | #317 | Tragic 7.2% |
| Ottawa | 0.0 /100 | #318 | Tragic 7.2% |
| Dominicans | 0.0 /100 | #319 | Tragic 7.2% |
| Potawatomi | 0.0 /100 | #320 | Tragic 7.3% |
Demographics Similar to Ethiopians by Ambulatory Disability
In terms of ambulatory disability, the demographic groups most similar to Ethiopians are Immigrants from Kuwait (5.4%, a difference of 0.0%), Indian (Asian) (5.4%, a difference of 0.020%), Immigrants from Sri Lanka (5.4%, a difference of 0.12%), Immigrants from Ethiopia (5.4%, a difference of 0.13%), and Immigrants from Israel (5.4%, a difference of 0.37%).
| Demographics | Rating | Rank | Ambulatory Disability |
| Burmese | 100.0 /100 | #13 | Exceptional 5.3% |
| Immigrants | Eastern Asia | 100.0 /100 | #14 | Exceptional 5.3% |
| Immigrants | China | 100.0 /100 | #15 | Exceptional 5.3% |
| Immigrants | Hong Kong | 100.0 /100 | #16 | Exceptional 5.3% |
| Immigrants | Ethiopia | 100.0 /100 | #17 | Exceptional 5.4% |
| Immigrants | Sri Lanka | 100.0 /100 | #18 | Exceptional 5.4% |
| Indians (Asian) | 100.0 /100 | #19 | Exceptional 5.4% |
| Ethiopians | 100.0 /100 | #20 | Exceptional 5.4% |
| Immigrants | Kuwait | 100.0 /100 | #21 | Exceptional 5.4% |
| Immigrants | Israel | 100.0 /100 | #22 | Exceptional 5.4% |
| Tongans | 100.0 /100 | #23 | Exceptional 5.4% |
| Immigrants | Saudi Arabia | 100.0 /100 | #24 | Exceptional 5.4% |
| Zimbabweans | 100.0 /100 | #25 | Exceptional 5.4% |
| Immigrants | Nepal | 100.0 /100 | #26 | Exceptional 5.4% |
| Asians | 100.0 /100 | #27 | Exceptional 5.4% |