Immigrants from Yemen vs Salvadoran Ambulatory Disability
COMPARE
Immigrants from Yemen
Salvadoran
Ambulatory Disability
Ambulatory Disability Comparison
Immigrants from Yemen
Salvadorans
7.1%
AMBULATORY DISABILITY
0.0/ 100
METRIC RATING
313th/ 347
METRIC RANK
5.8%
AMBULATORY DISABILITY
98.4/ 100
METRIC RATING
96th/ 347
METRIC RANK
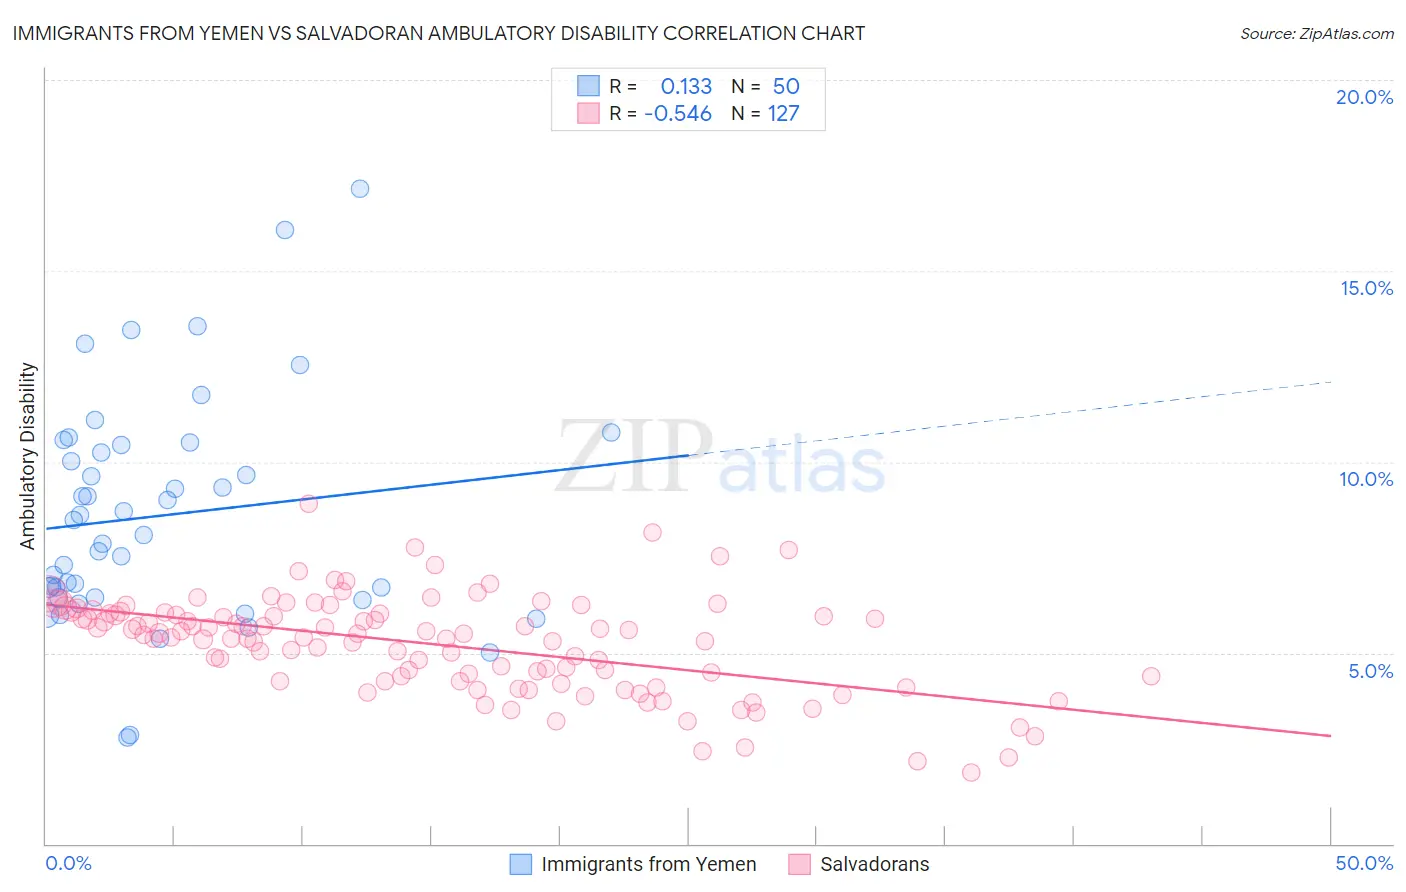
Immigrants from Yemen vs Salvadoran Ambulatory Disability Correlation Chart
The statistical analysis conducted on geographies consisting of 82,432,015 people shows a poor positive correlation between the proportion of Immigrants from Yemen and percentage of population with ambulatory disability in the United States with a correlation coefficient (R) of 0.133 and weighted average of 7.1%. Similarly, the statistical analysis conducted on geographies consisting of 398,824,360 people shows a substantial negative correlation between the proportion of Salvadorans and percentage of population with ambulatory disability in the United States with a correlation coefficient (R) of -0.546 and weighted average of 5.8%, a difference of 23.2%.
Ambulatory Disability Correlation Summary
| Measurement | Immigrants from Yemen | Salvadoran |
| Minimum | 2.8% | 1.9% |
| Maximum | 17.1% | 8.9% |
| Range | 14.4% | 7.0% |
| Mean | 8.6% | 5.2% |
| Median | 8.3% | 5.5% |
| Interquartile 25% (IQ1) | 6.4% | 4.3% |
| Interquartile 75% (IQ3) | 10.4% | 6.0% |
| Interquartile Range (IQR) | 4.0% | 1.8% |
| Standard Deviation (Sample) | 3.0% | 1.3% |
| Standard Deviation (Population) | 2.9% | 1.3% |
Similar Demographics by Ambulatory Disability
Demographics Similar to Immigrants from Yemen by Ambulatory Disability
In terms of ambulatory disability, the demographic groups most similar to Immigrants from Yemen are Blackfeet (7.1%, a difference of 0.020%), Shoshone (7.1%, a difference of 0.040%), Delaware (7.1%, a difference of 0.13%), Immigrants from Dominican Republic (7.1%, a difference of 0.28%), and Cree (7.1%, a difference of 0.35%).
| Demographics | Rating | Rank | Ambulatory Disability |
| Iroquois | 0.0 /100 | #306 | Tragic 7.1% |
| Spanish Americans | 0.0 /100 | #307 | Tragic 7.1% |
| Chippewa | 0.0 /100 | #308 | Tragic 7.1% |
| Immigrants | Azores | 0.0 /100 | #309 | Tragic 7.1% |
| Arapaho | 0.0 /100 | #310 | Tragic 7.1% |
| Cree | 0.0 /100 | #311 | Tragic 7.1% |
| Delaware | 0.0 /100 | #312 | Tragic 7.1% |
| Immigrants | Yemen | 0.0 /100 | #313 | Tragic 7.1% |
| Blackfeet | 0.0 /100 | #314 | Tragic 7.1% |
| Shoshone | 0.0 /100 | #315 | Tragic 7.1% |
| Immigrants | Dominican Republic | 0.0 /100 | #316 | Tragic 7.1% |
| Central American Indians | 0.0 /100 | #317 | Tragic 7.2% |
| Ottawa | 0.0 /100 | #318 | Tragic 7.2% |
| Dominicans | 0.0 /100 | #319 | Tragic 7.2% |
| Potawatomi | 0.0 /100 | #320 | Tragic 7.3% |
Demographics Similar to Salvadorans by Ambulatory Disability
In terms of ambulatory disability, the demographic groups most similar to Salvadorans are Immigrants from El Salvador (5.8%, a difference of 0.020%), Immigrants from Somalia (5.8%, a difference of 0.040%), Kenyan (5.8%, a difference of 0.060%), Immigrants from Lebanon (5.8%, a difference of 0.070%), and Immigrants from Northern Europe (5.8%, a difference of 0.15%).
| Demographics | Rating | Rank | Ambulatory Disability |
| Bhutanese | 98.8 /100 | #89 | Exceptional 5.8% |
| Australians | 98.8 /100 | #90 | Exceptional 5.8% |
| Immigrants | Sudan | 98.8 /100 | #91 | Exceptional 5.8% |
| Immigrants | Sierra Leone | 98.6 /100 | #92 | Exceptional 5.8% |
| Immigrants | Denmark | 98.6 /100 | #93 | Exceptional 5.8% |
| Kenyans | 98.4 /100 | #94 | Exceptional 5.8% |
| Immigrants | El Salvador | 98.4 /100 | #95 | Exceptional 5.8% |
| Salvadorans | 98.4 /100 | #96 | Exceptional 5.8% |
| Immigrants | Somalia | 98.3 /100 | #97 | Exceptional 5.8% |
| Immigrants | Lebanon | 98.3 /100 | #98 | Exceptional 5.8% |
| Immigrants | Northern Europe | 98.2 /100 | #99 | Exceptional 5.8% |
| Immigrants | Serbia | 97.9 /100 | #100 | Exceptional 5.8% |
| Immigrants | South America | 97.9 /100 | #101 | Exceptional 5.8% |
| Immigrants | Kenya | 97.8 /100 | #102 | Exceptional 5.8% |
| Immigrants | Romania | 97.7 /100 | #103 | Exceptional 5.8% |